Create an Interface with JupyterLite (ZSL Algorithm)
This tutorial explains how to create an interface between two materials in Materials Designer using the Zur and McGill Superlattice (ZSL) algorithm. The example demonstrates creating an interface between Graphene and Ni(111).
1. Open Materials Designer
Open an instance of the Materials Designer Interface.
2. Import the materials
In order to use Graphene and Ni, the respective crystalline structures should first be imported into the current Materials Designer session from the account-owned collection of materials.
Another option is to use materials from a Standard Materials Dataset via Import from Standata.
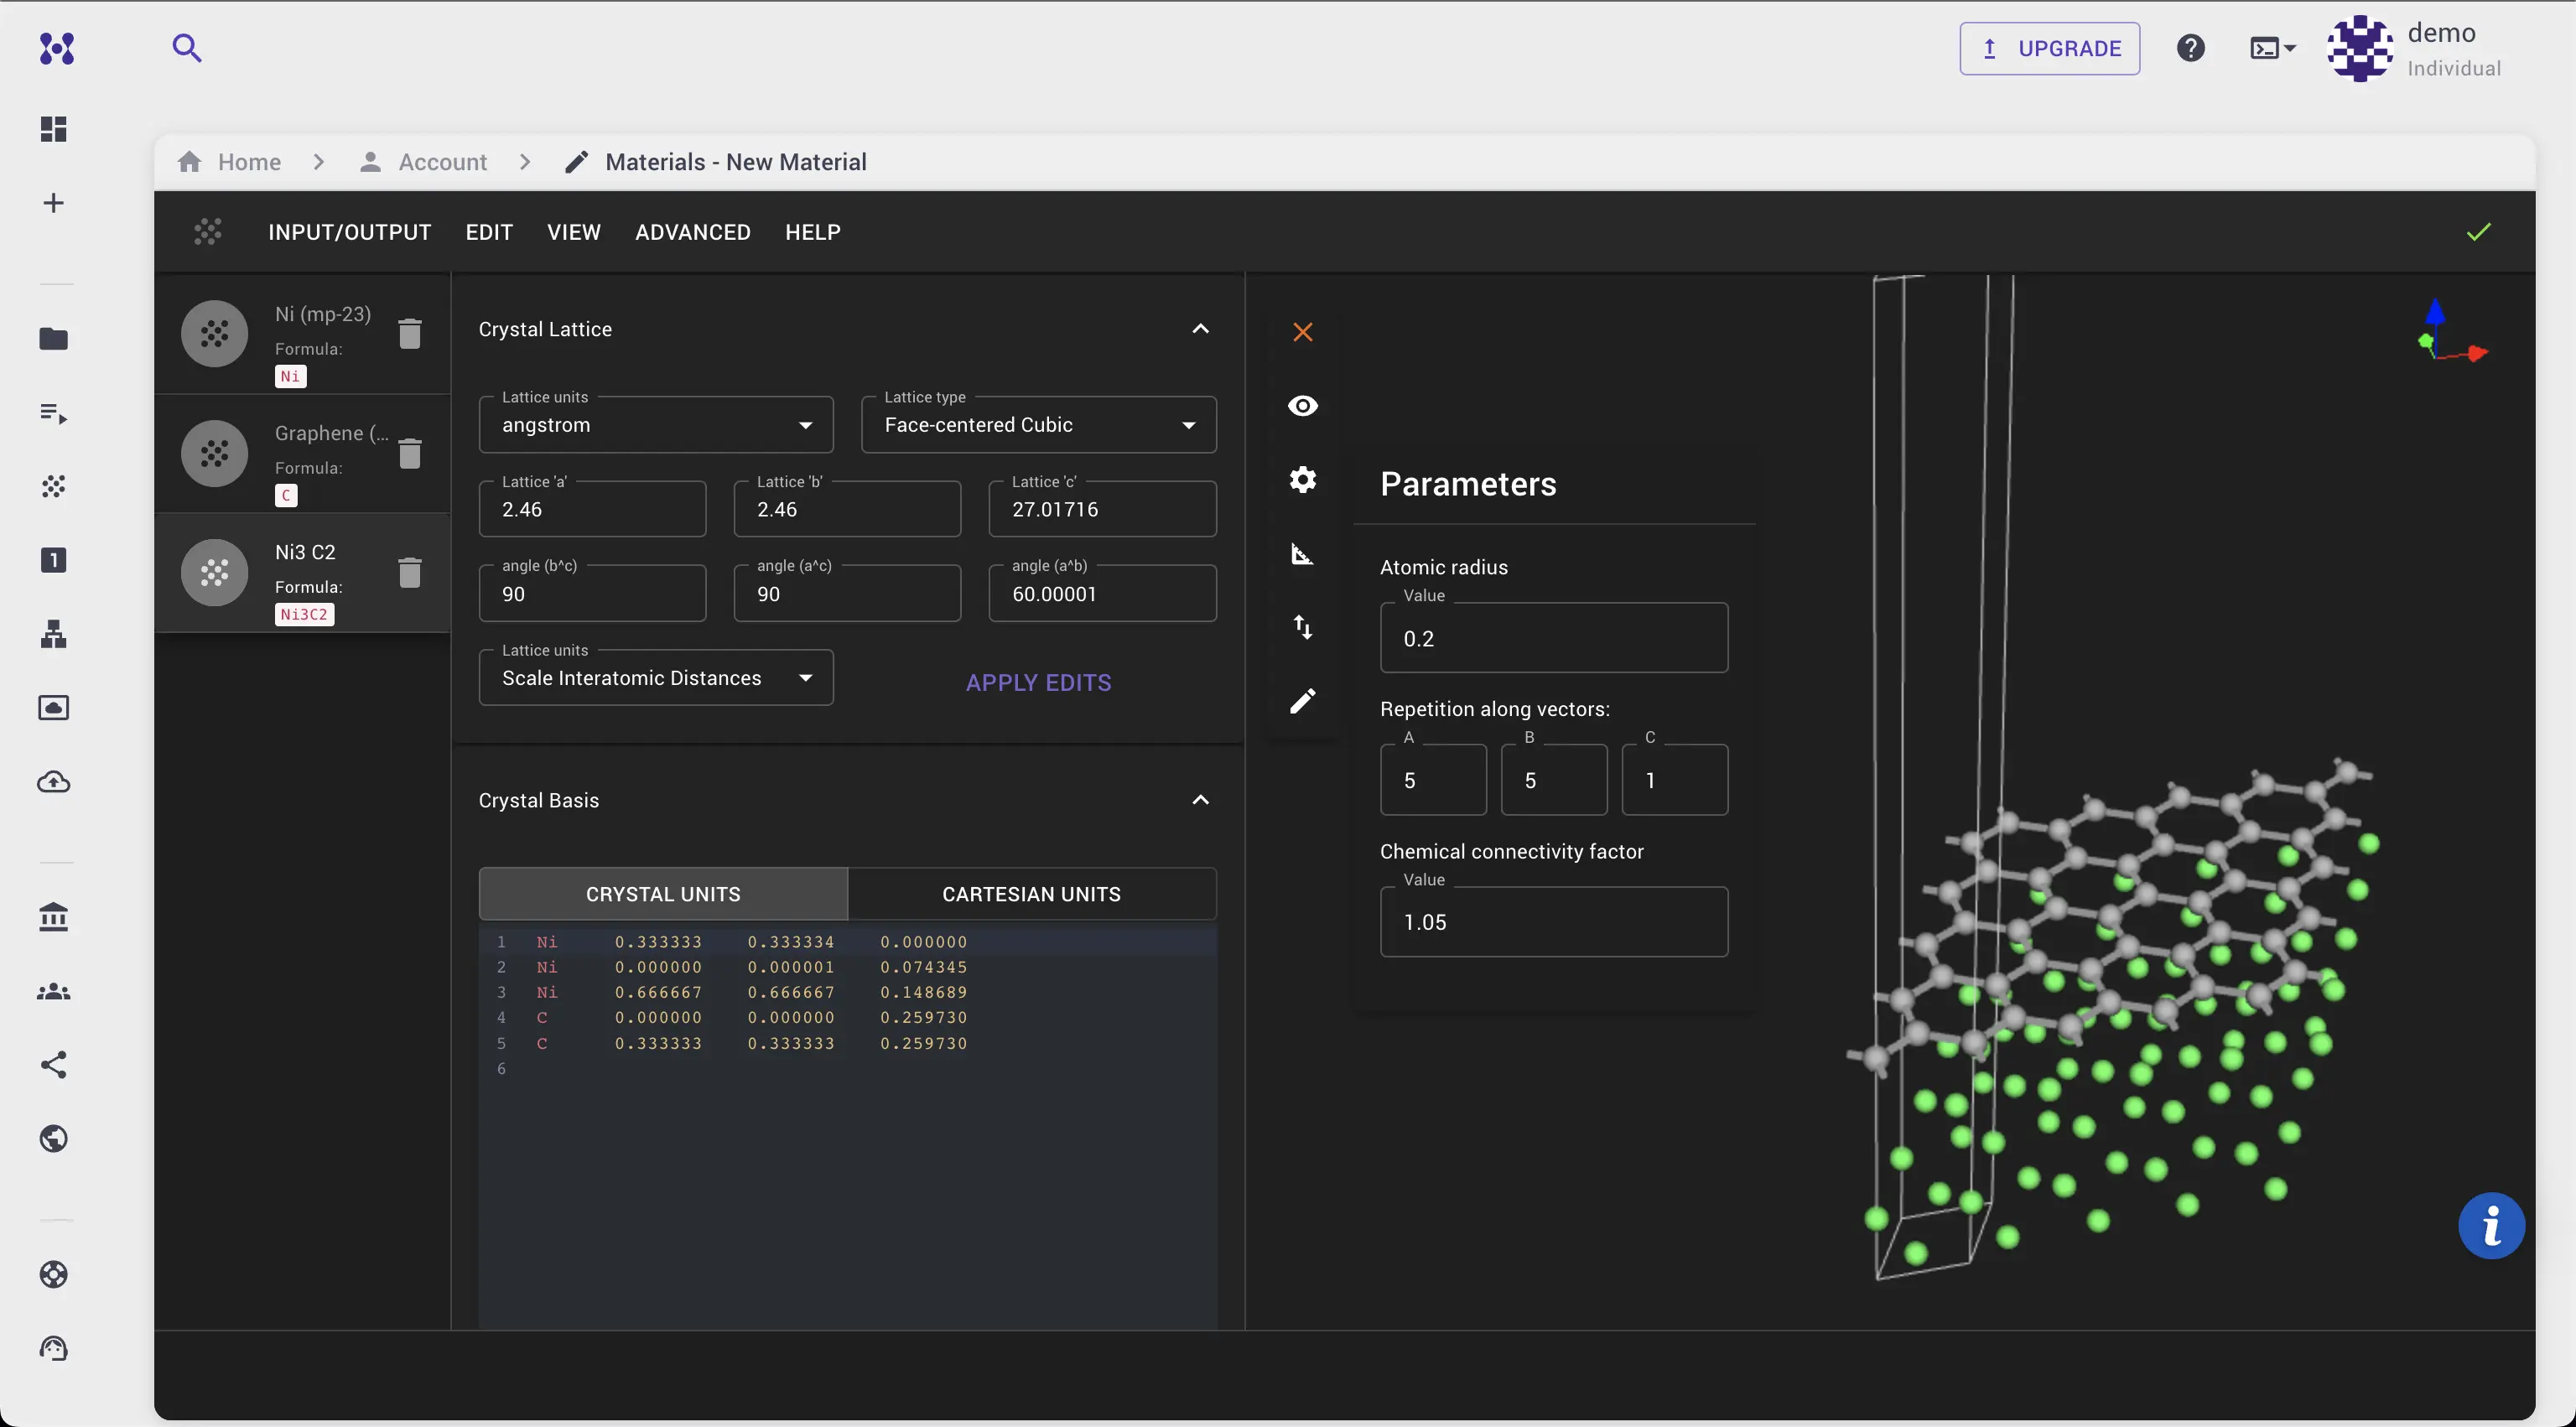
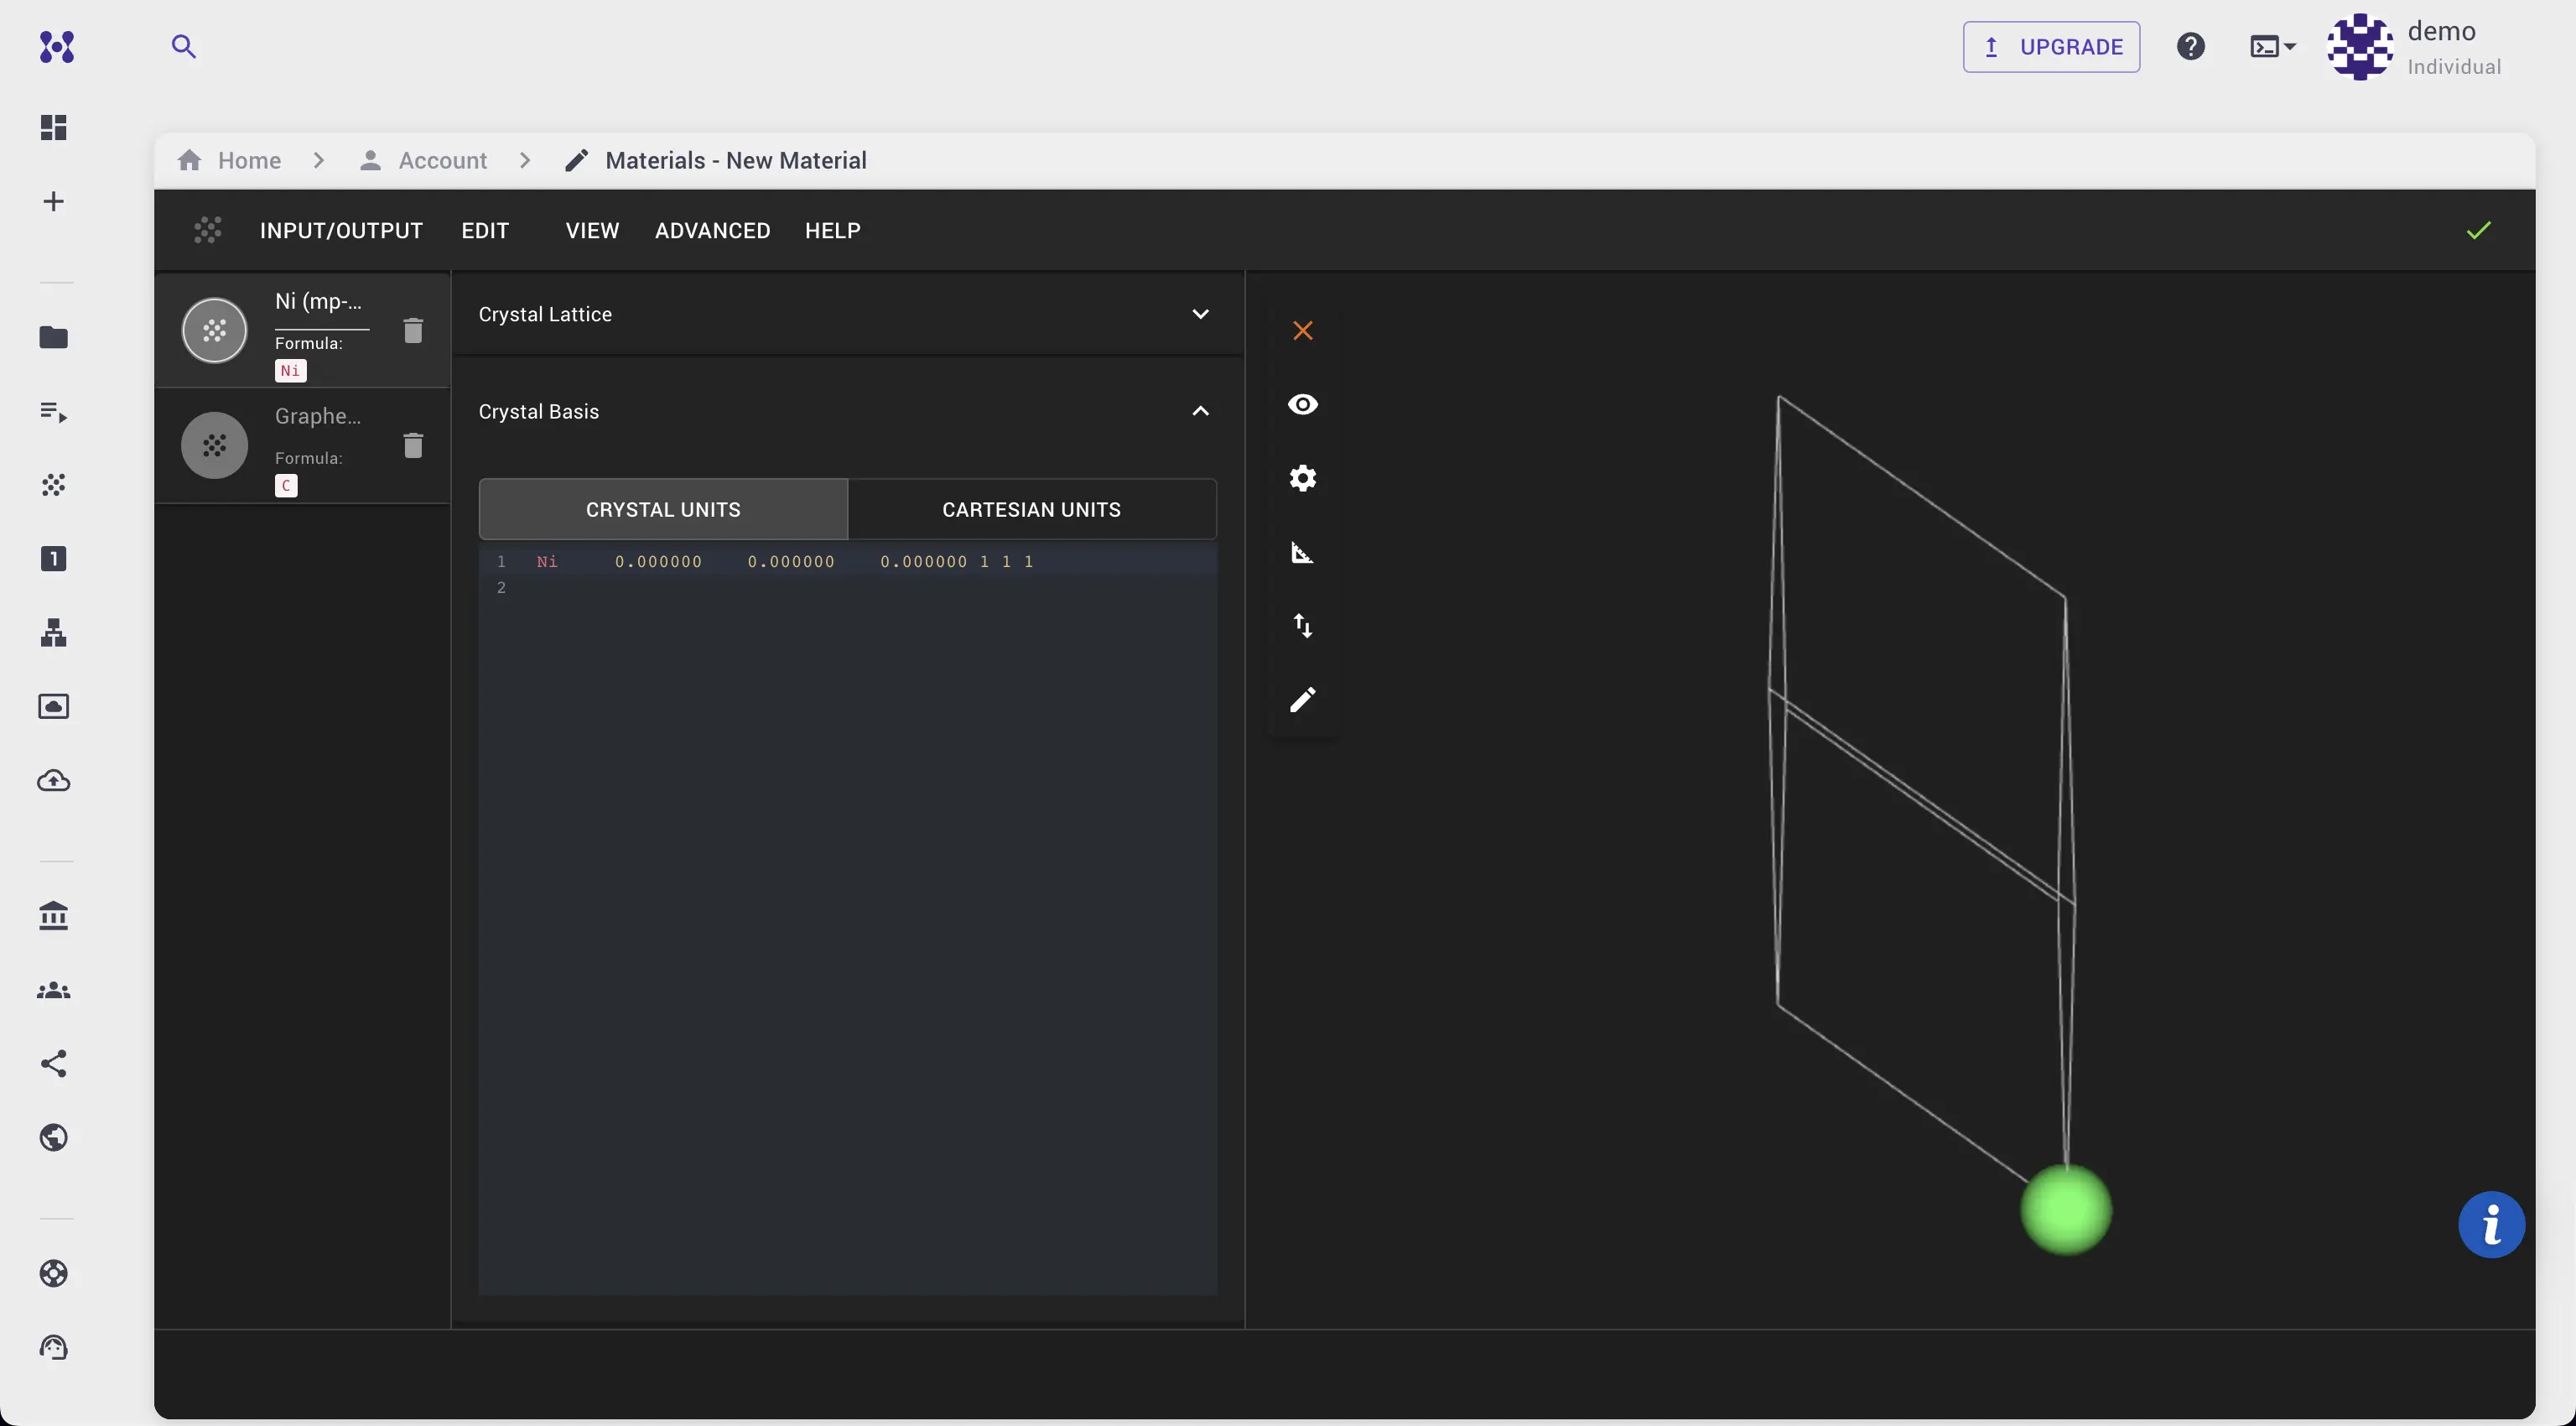
After importing, Graphene and Ni should be available in the materials list.
3. Open the JupyterLite Session dialog
Navigate to Advanced > JupyterLite Session from the main interface.

In the Introduction notebook, find the link to the example under Examples > 1. Builders / Transformations > 1.1. Interface creation with Zur and McGill Superlattice algorithm.
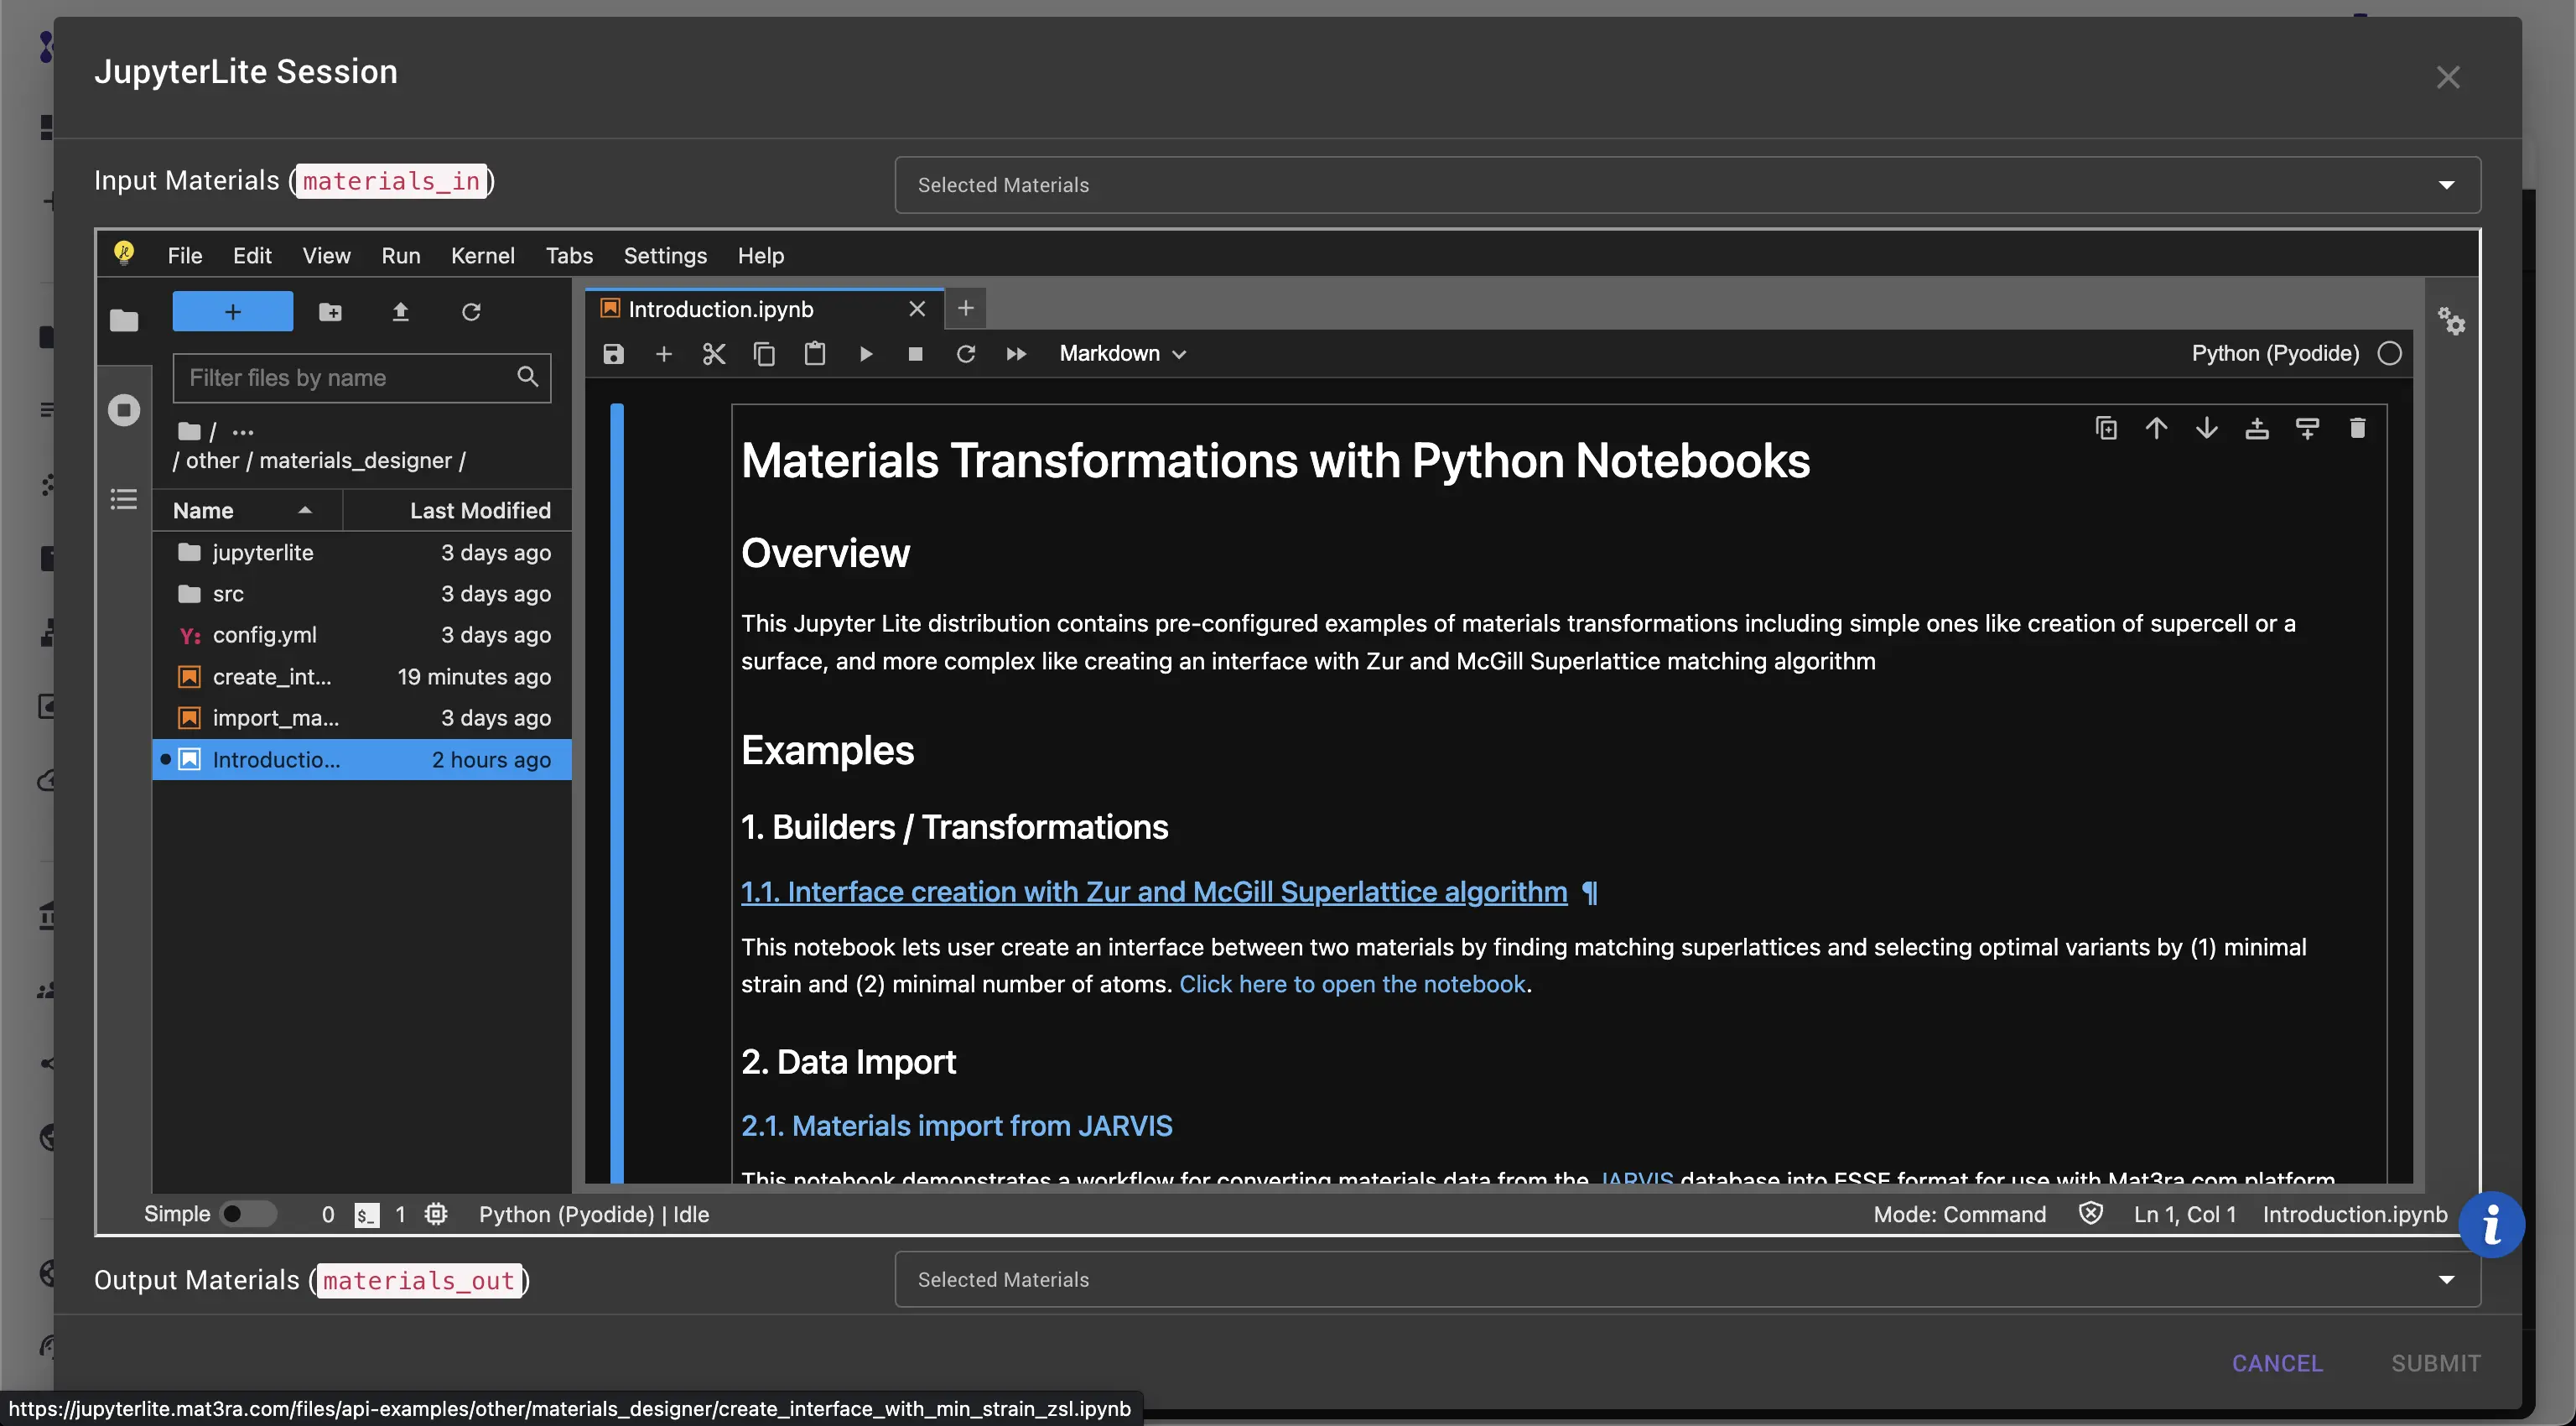
The link opens the example notebook in a new tab.
4. Run the example
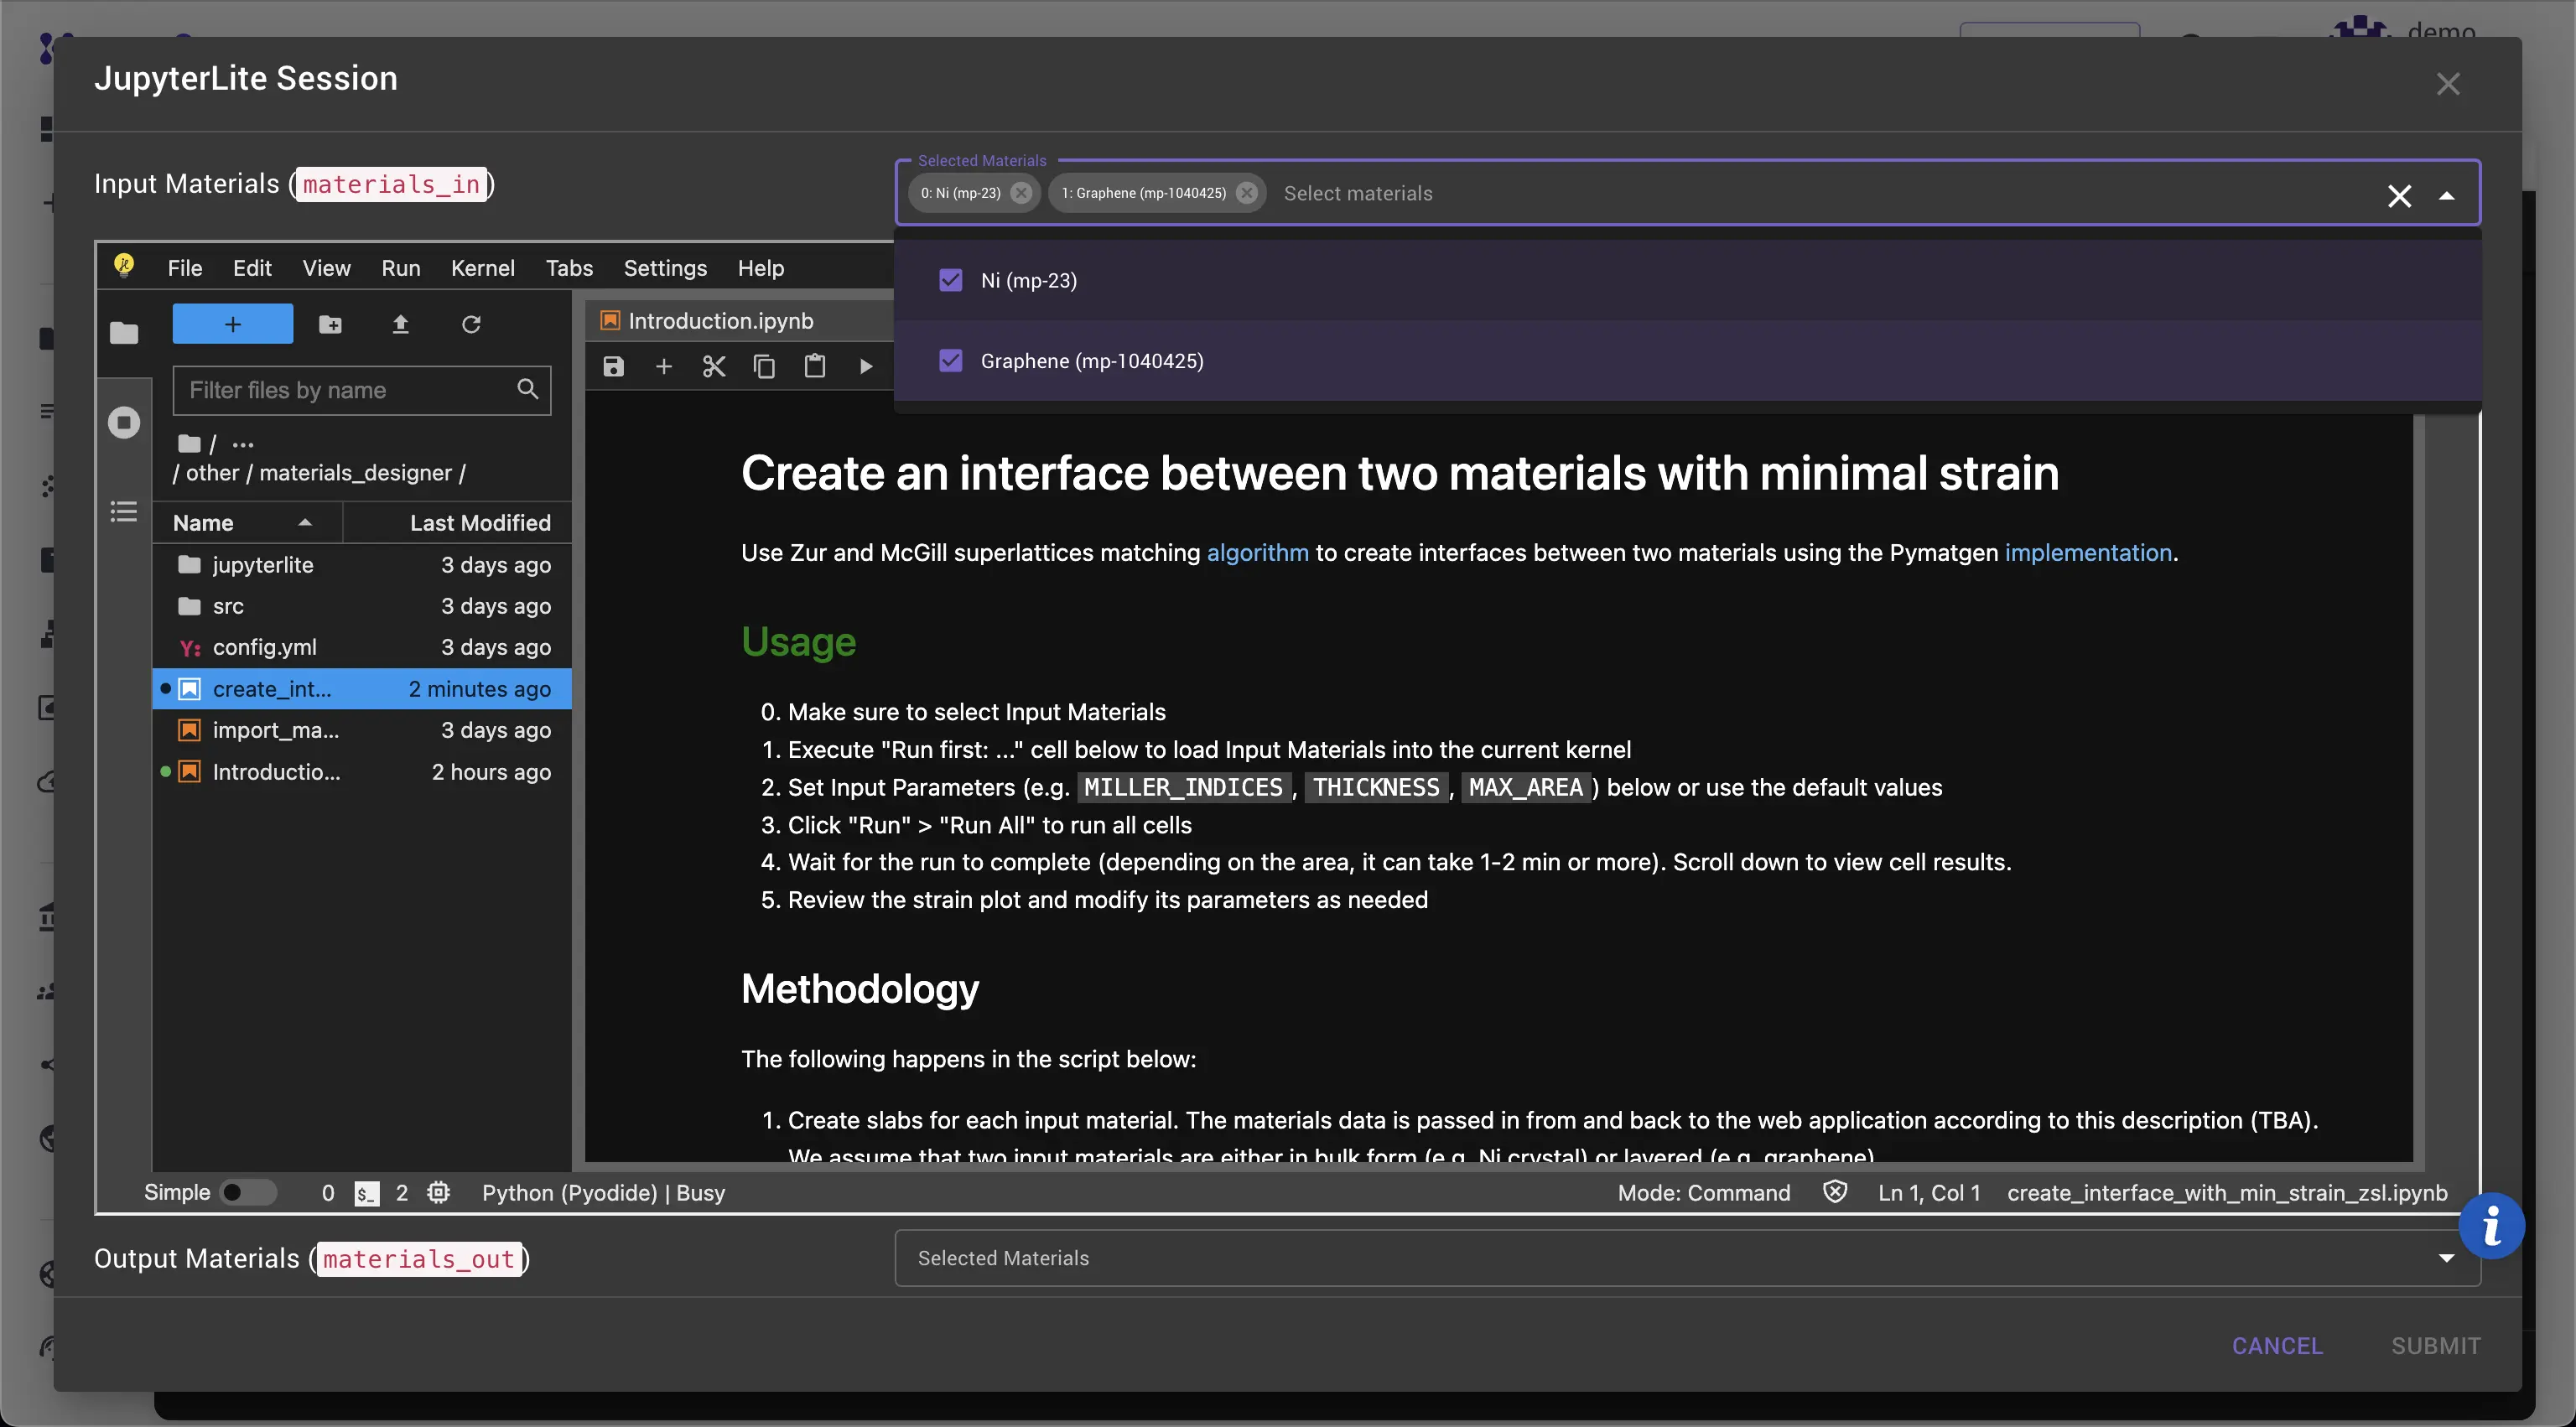
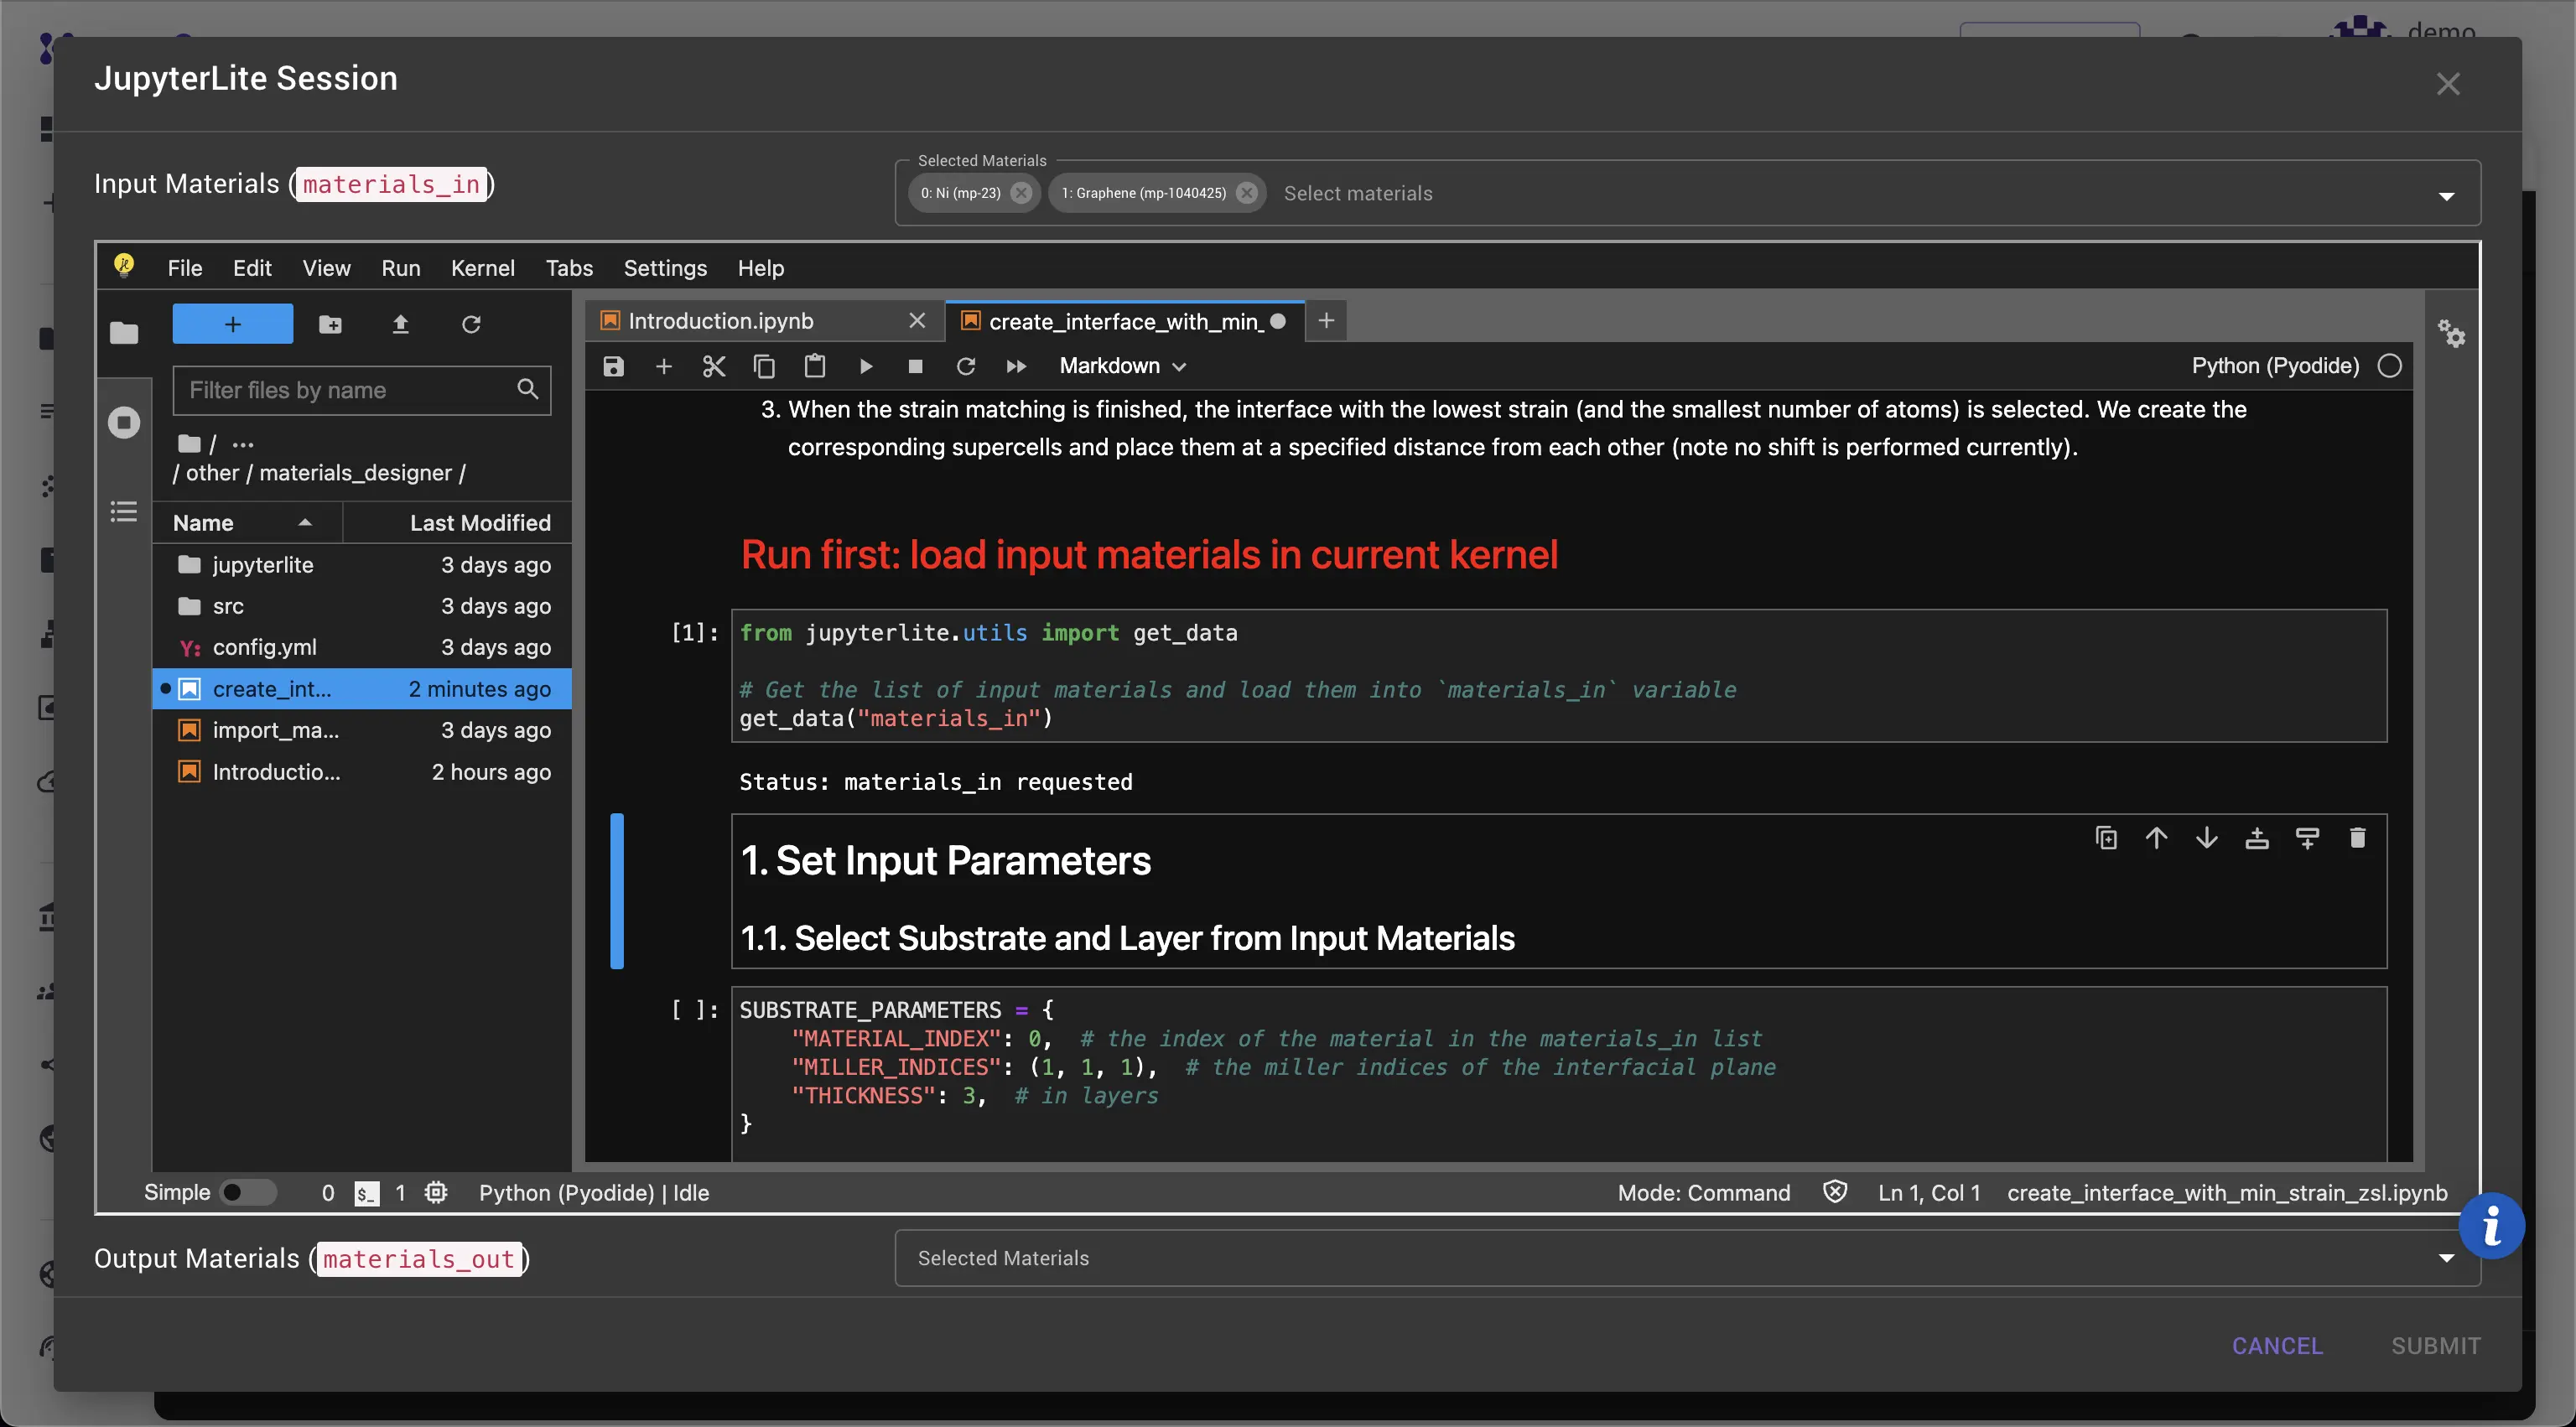
Select Input Materials from the dropdown list to make them available in the notebook (Ni and Graphene in this case).
Run the cell marked as Run first to load the input materials into the notebook. Loading is done asynchronously from outside the JupyterLite kernel, so it may take a few seconds for the kernel to register.
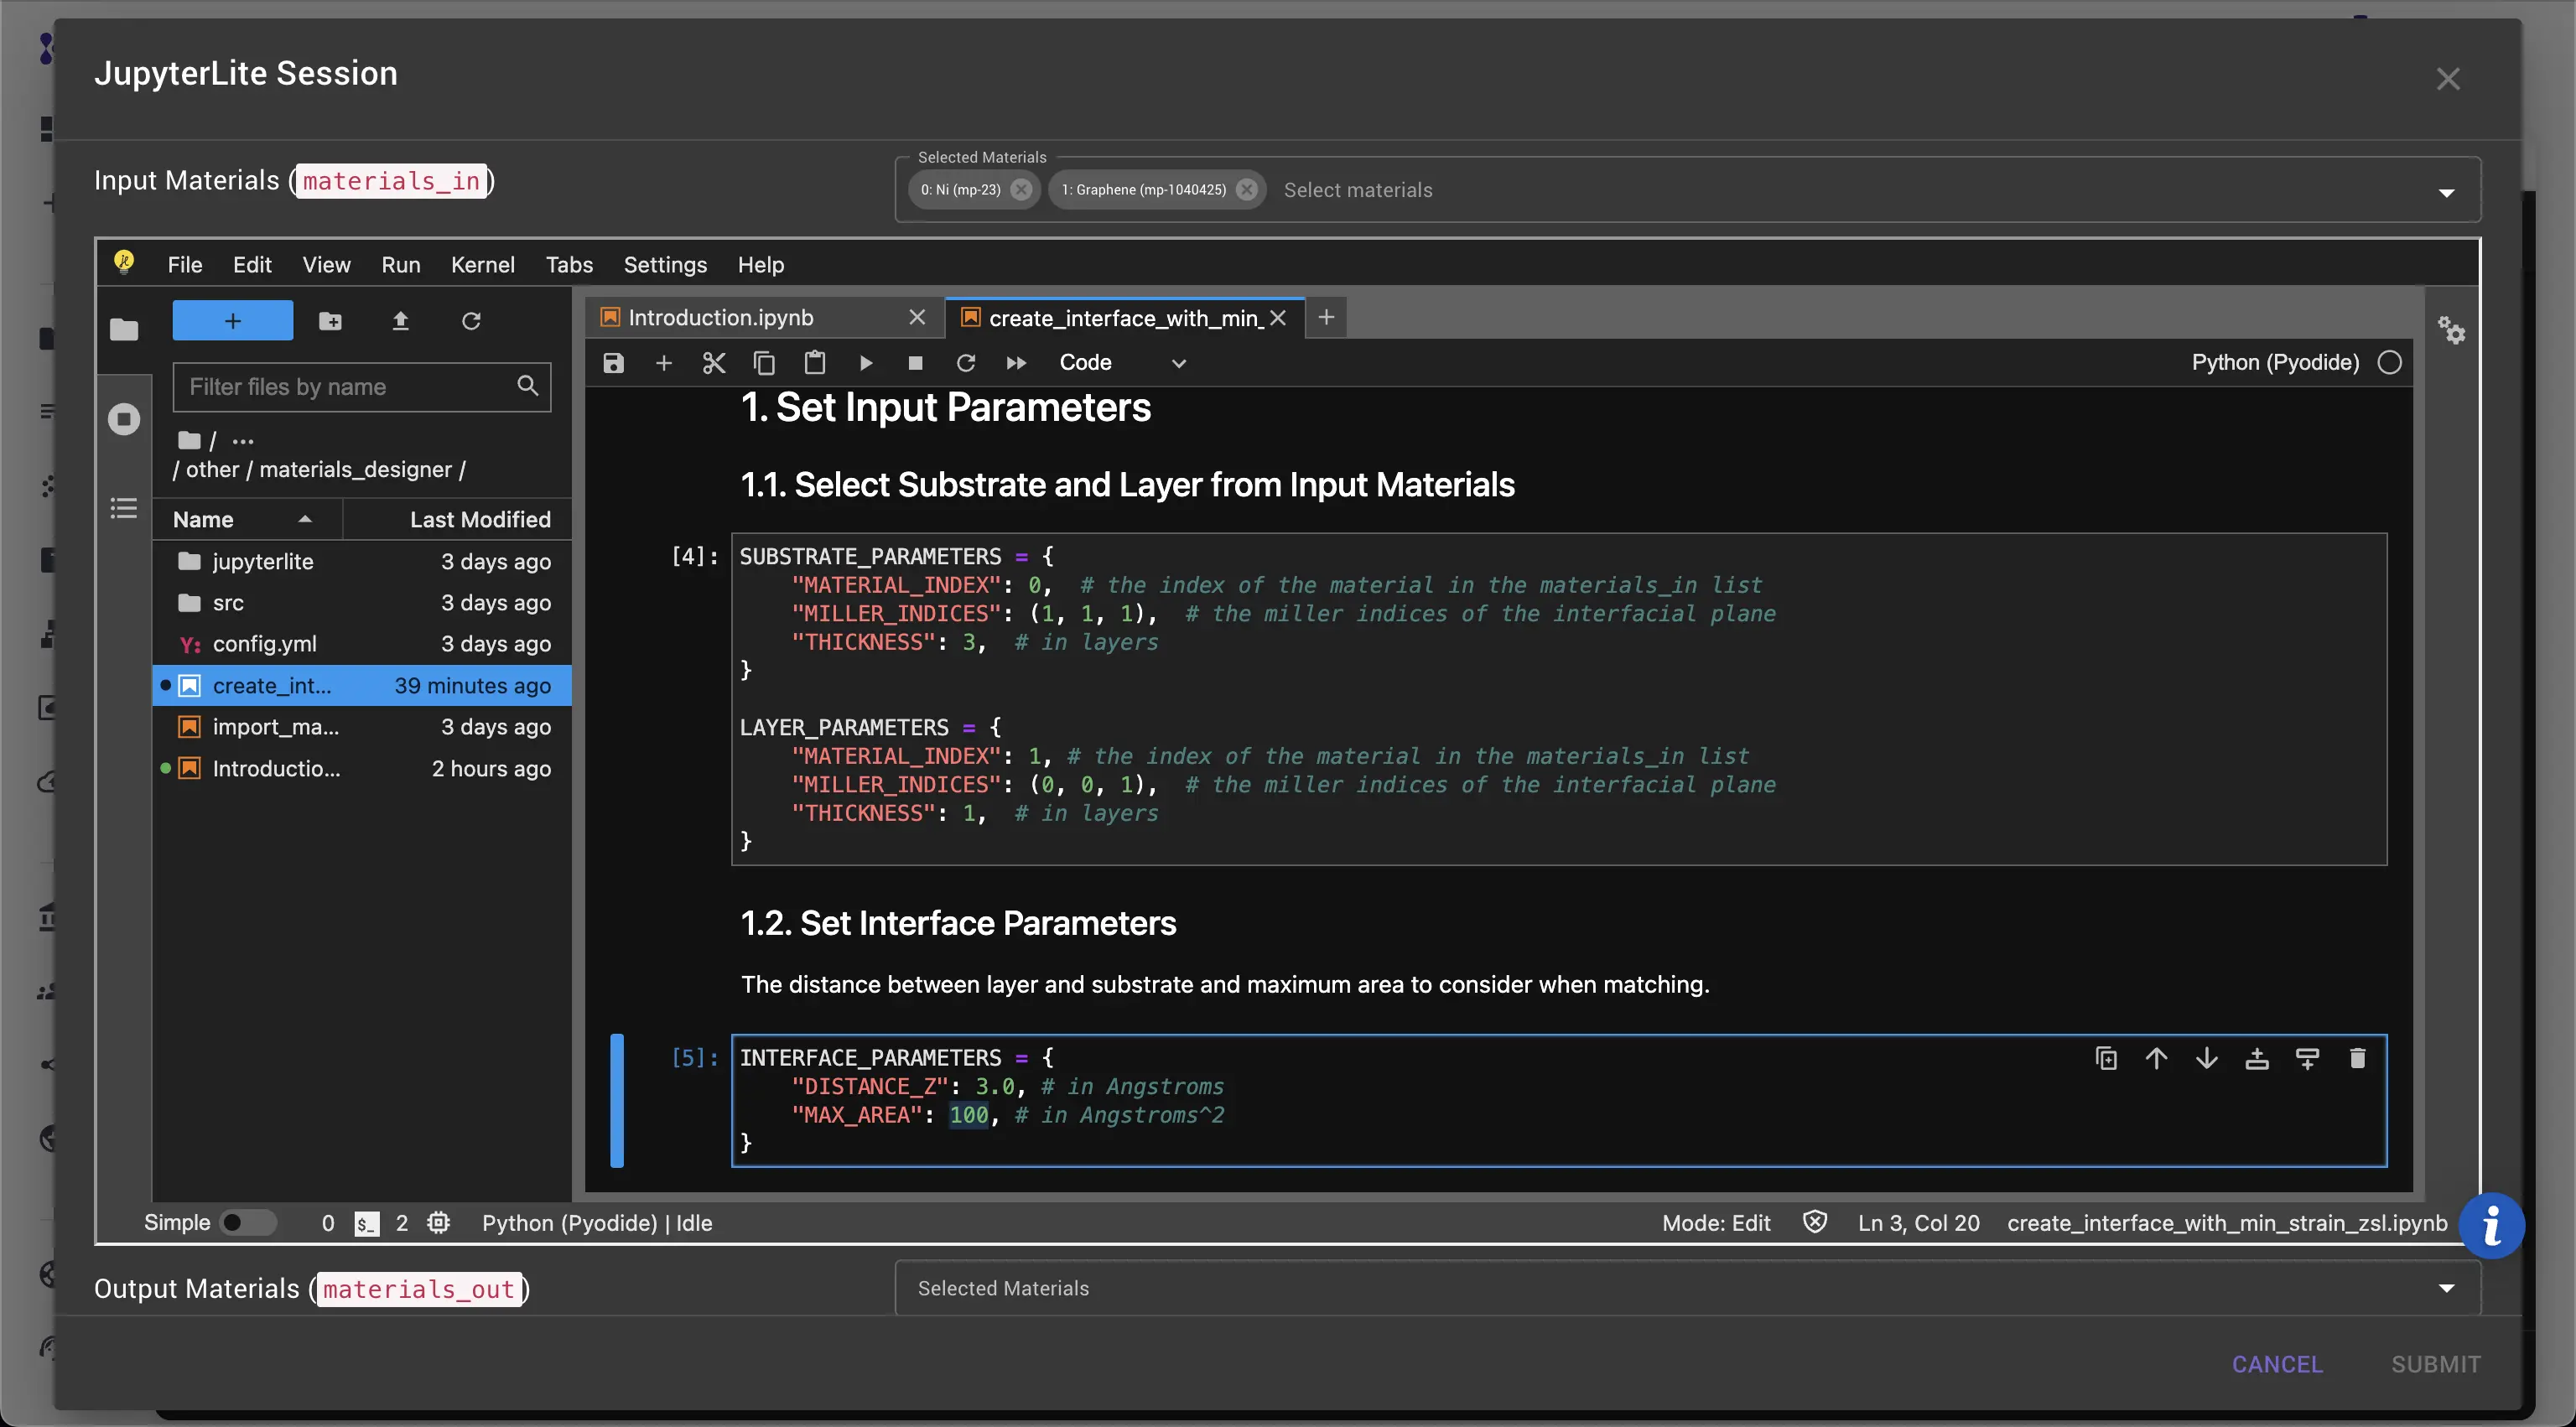
Set Input Parameters for substrate and layer materials, the resulting interface, and the algorithm. In this case, Ni is the substrate and Graphene is the layer. Since the unit lattices of Graphene and Ni(111) are close in size, the maximum search area for superlattice matching should be reduced to 100 Ų to speed up the search.
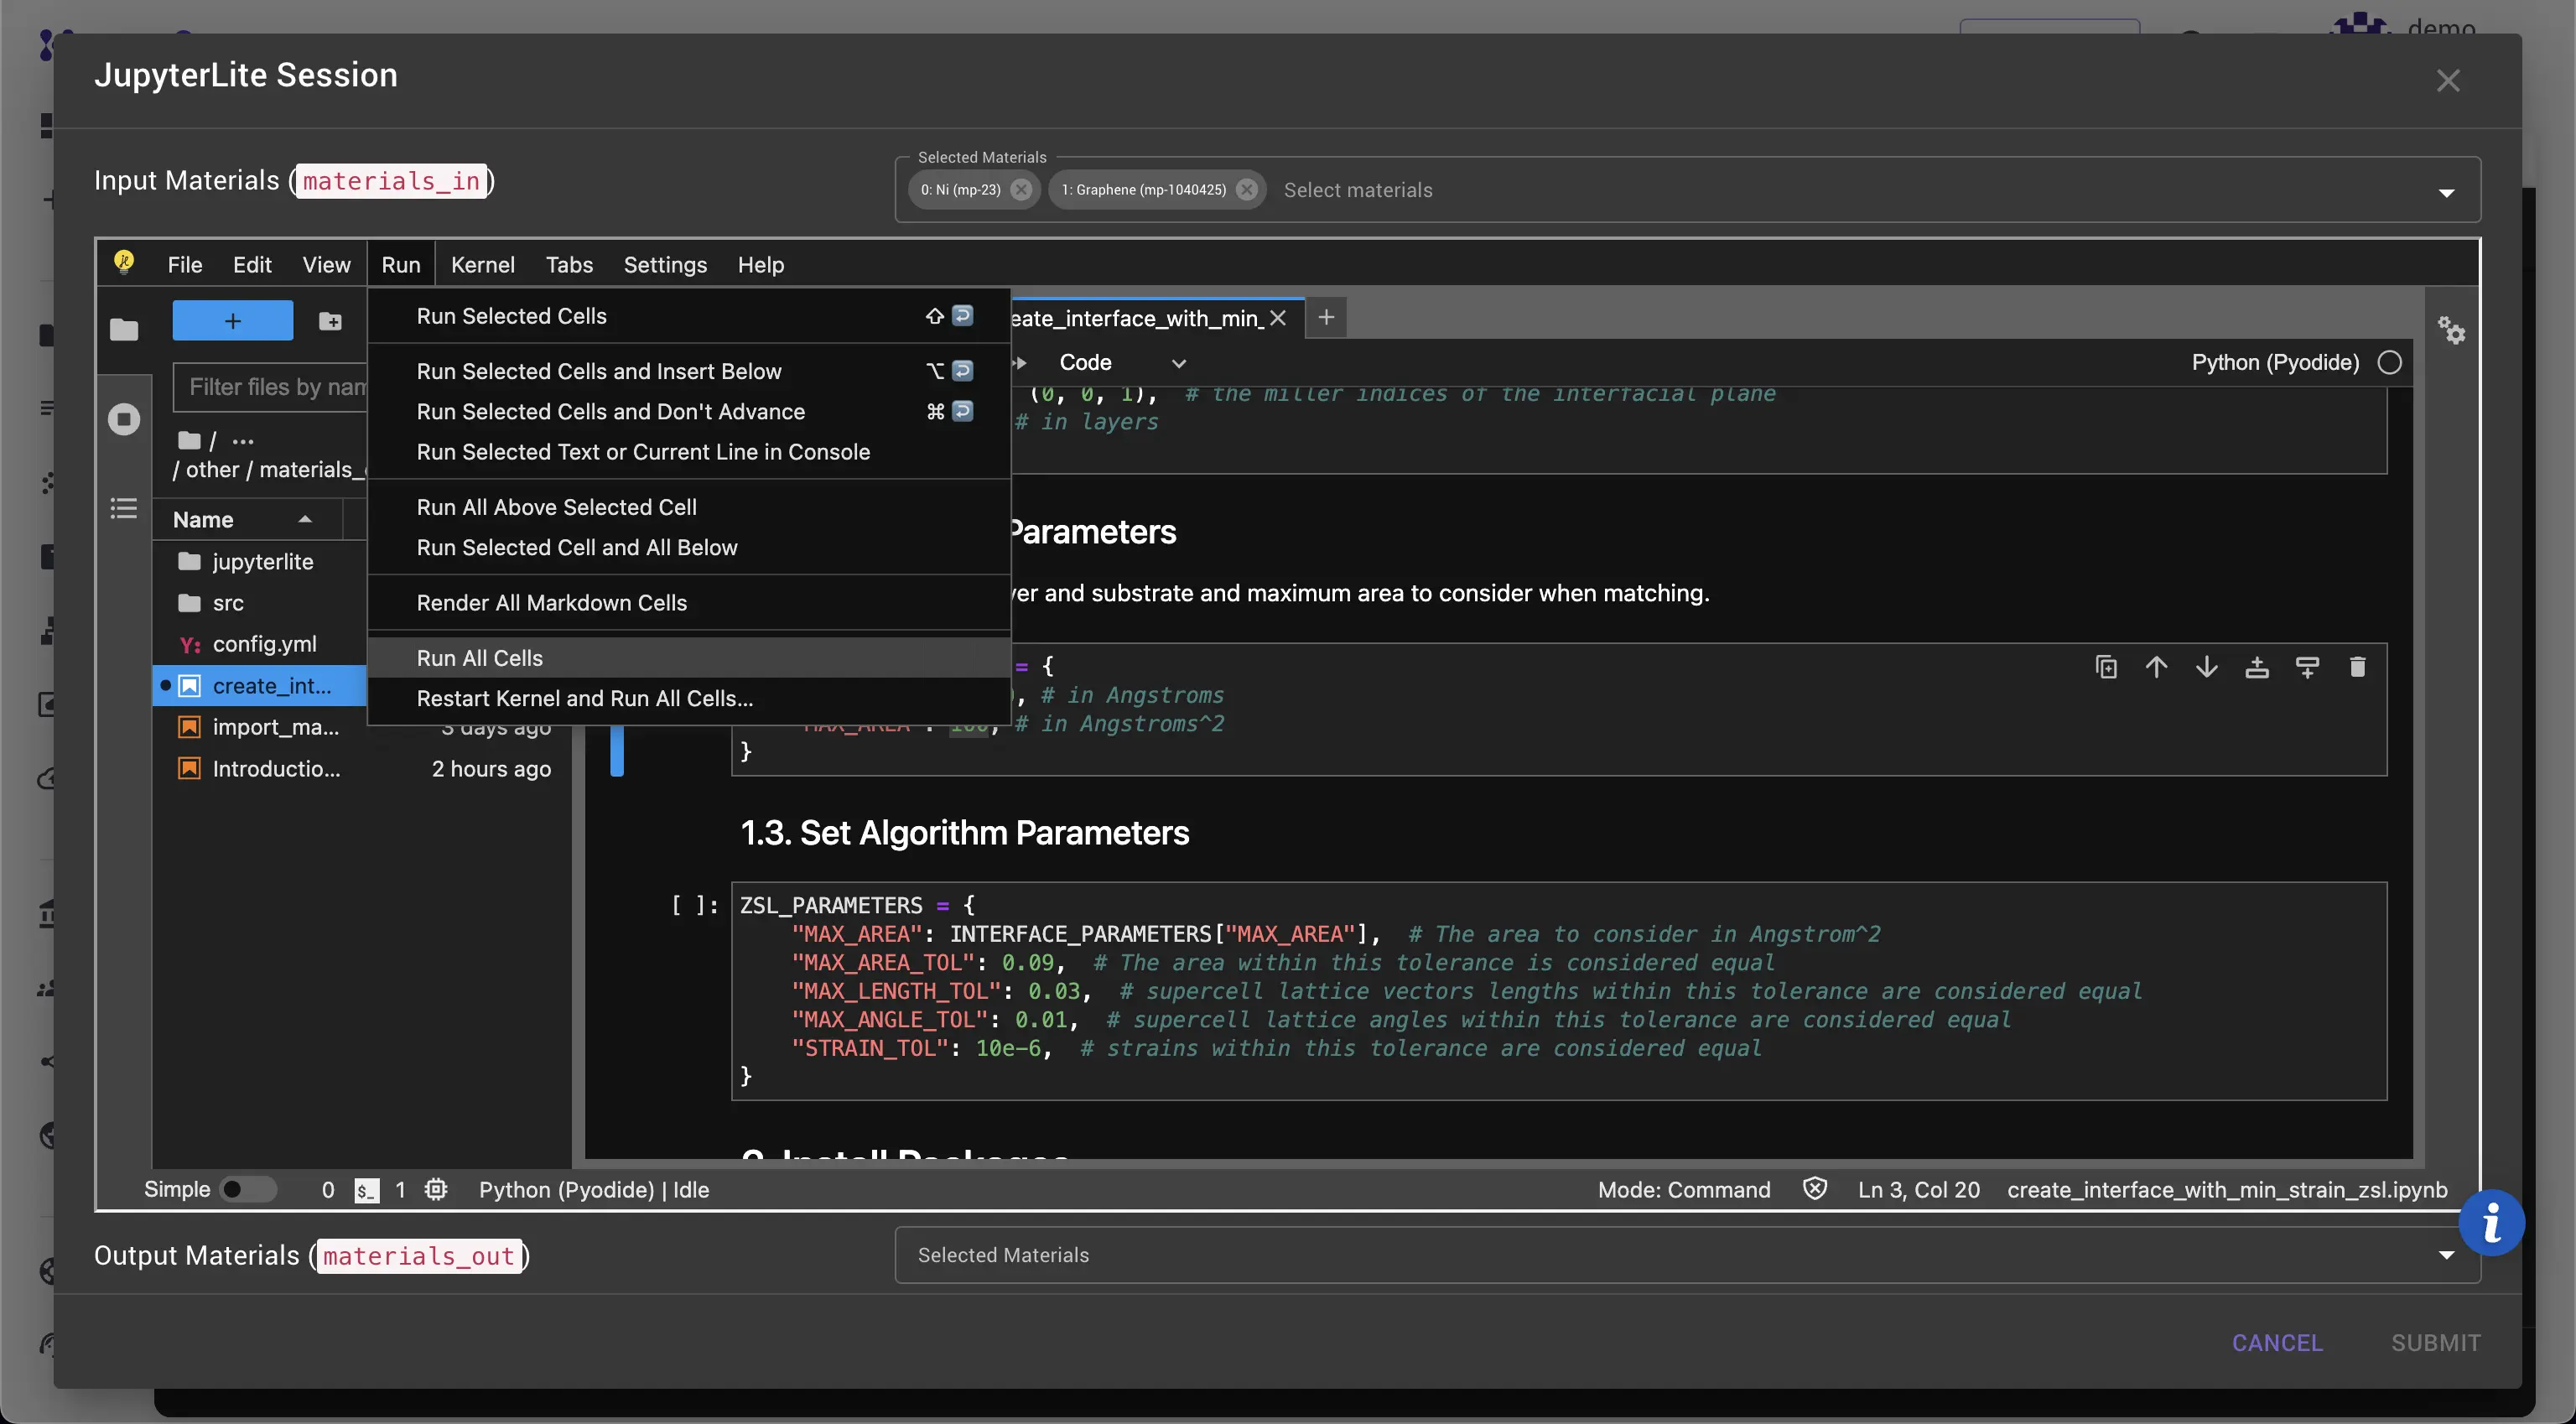
Click Run > Run All to run all cells and wait for the results to appear. Depending on the MAX_AREA parameter, the search may take from seconds to a few minutes.
5. Analyze the results
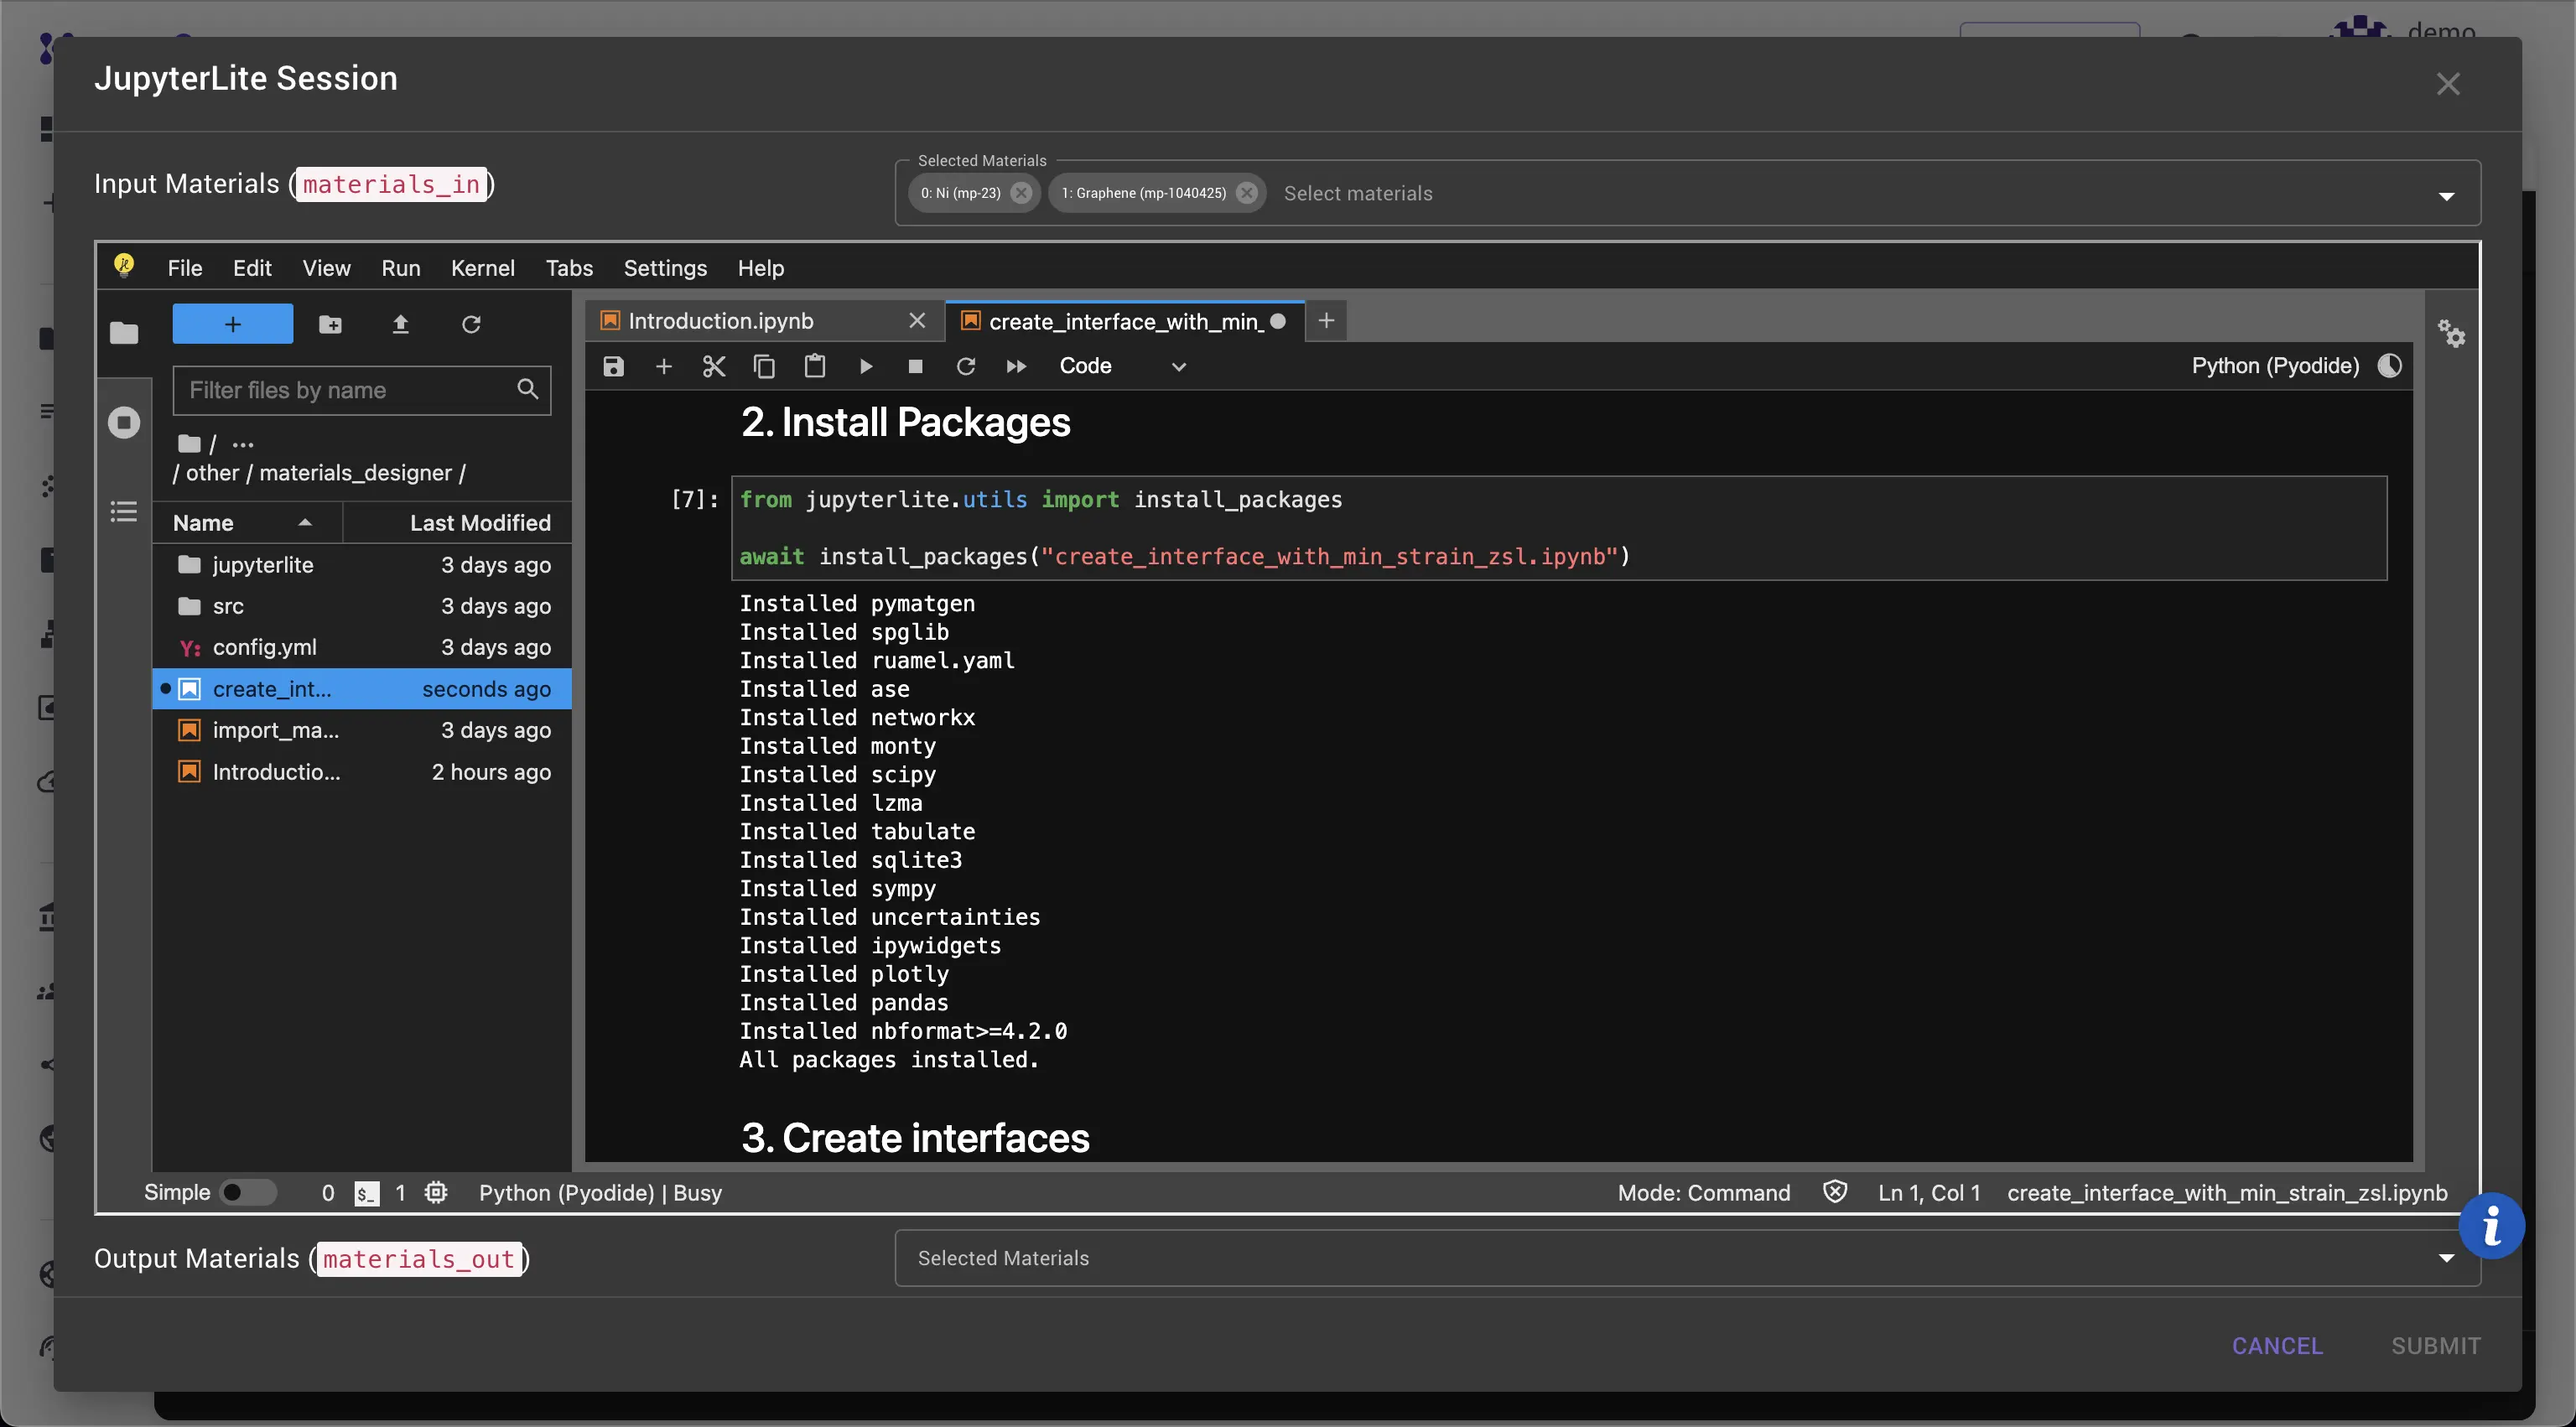
The output of the cell under "2. Install Packages" displays a list of installed packages.
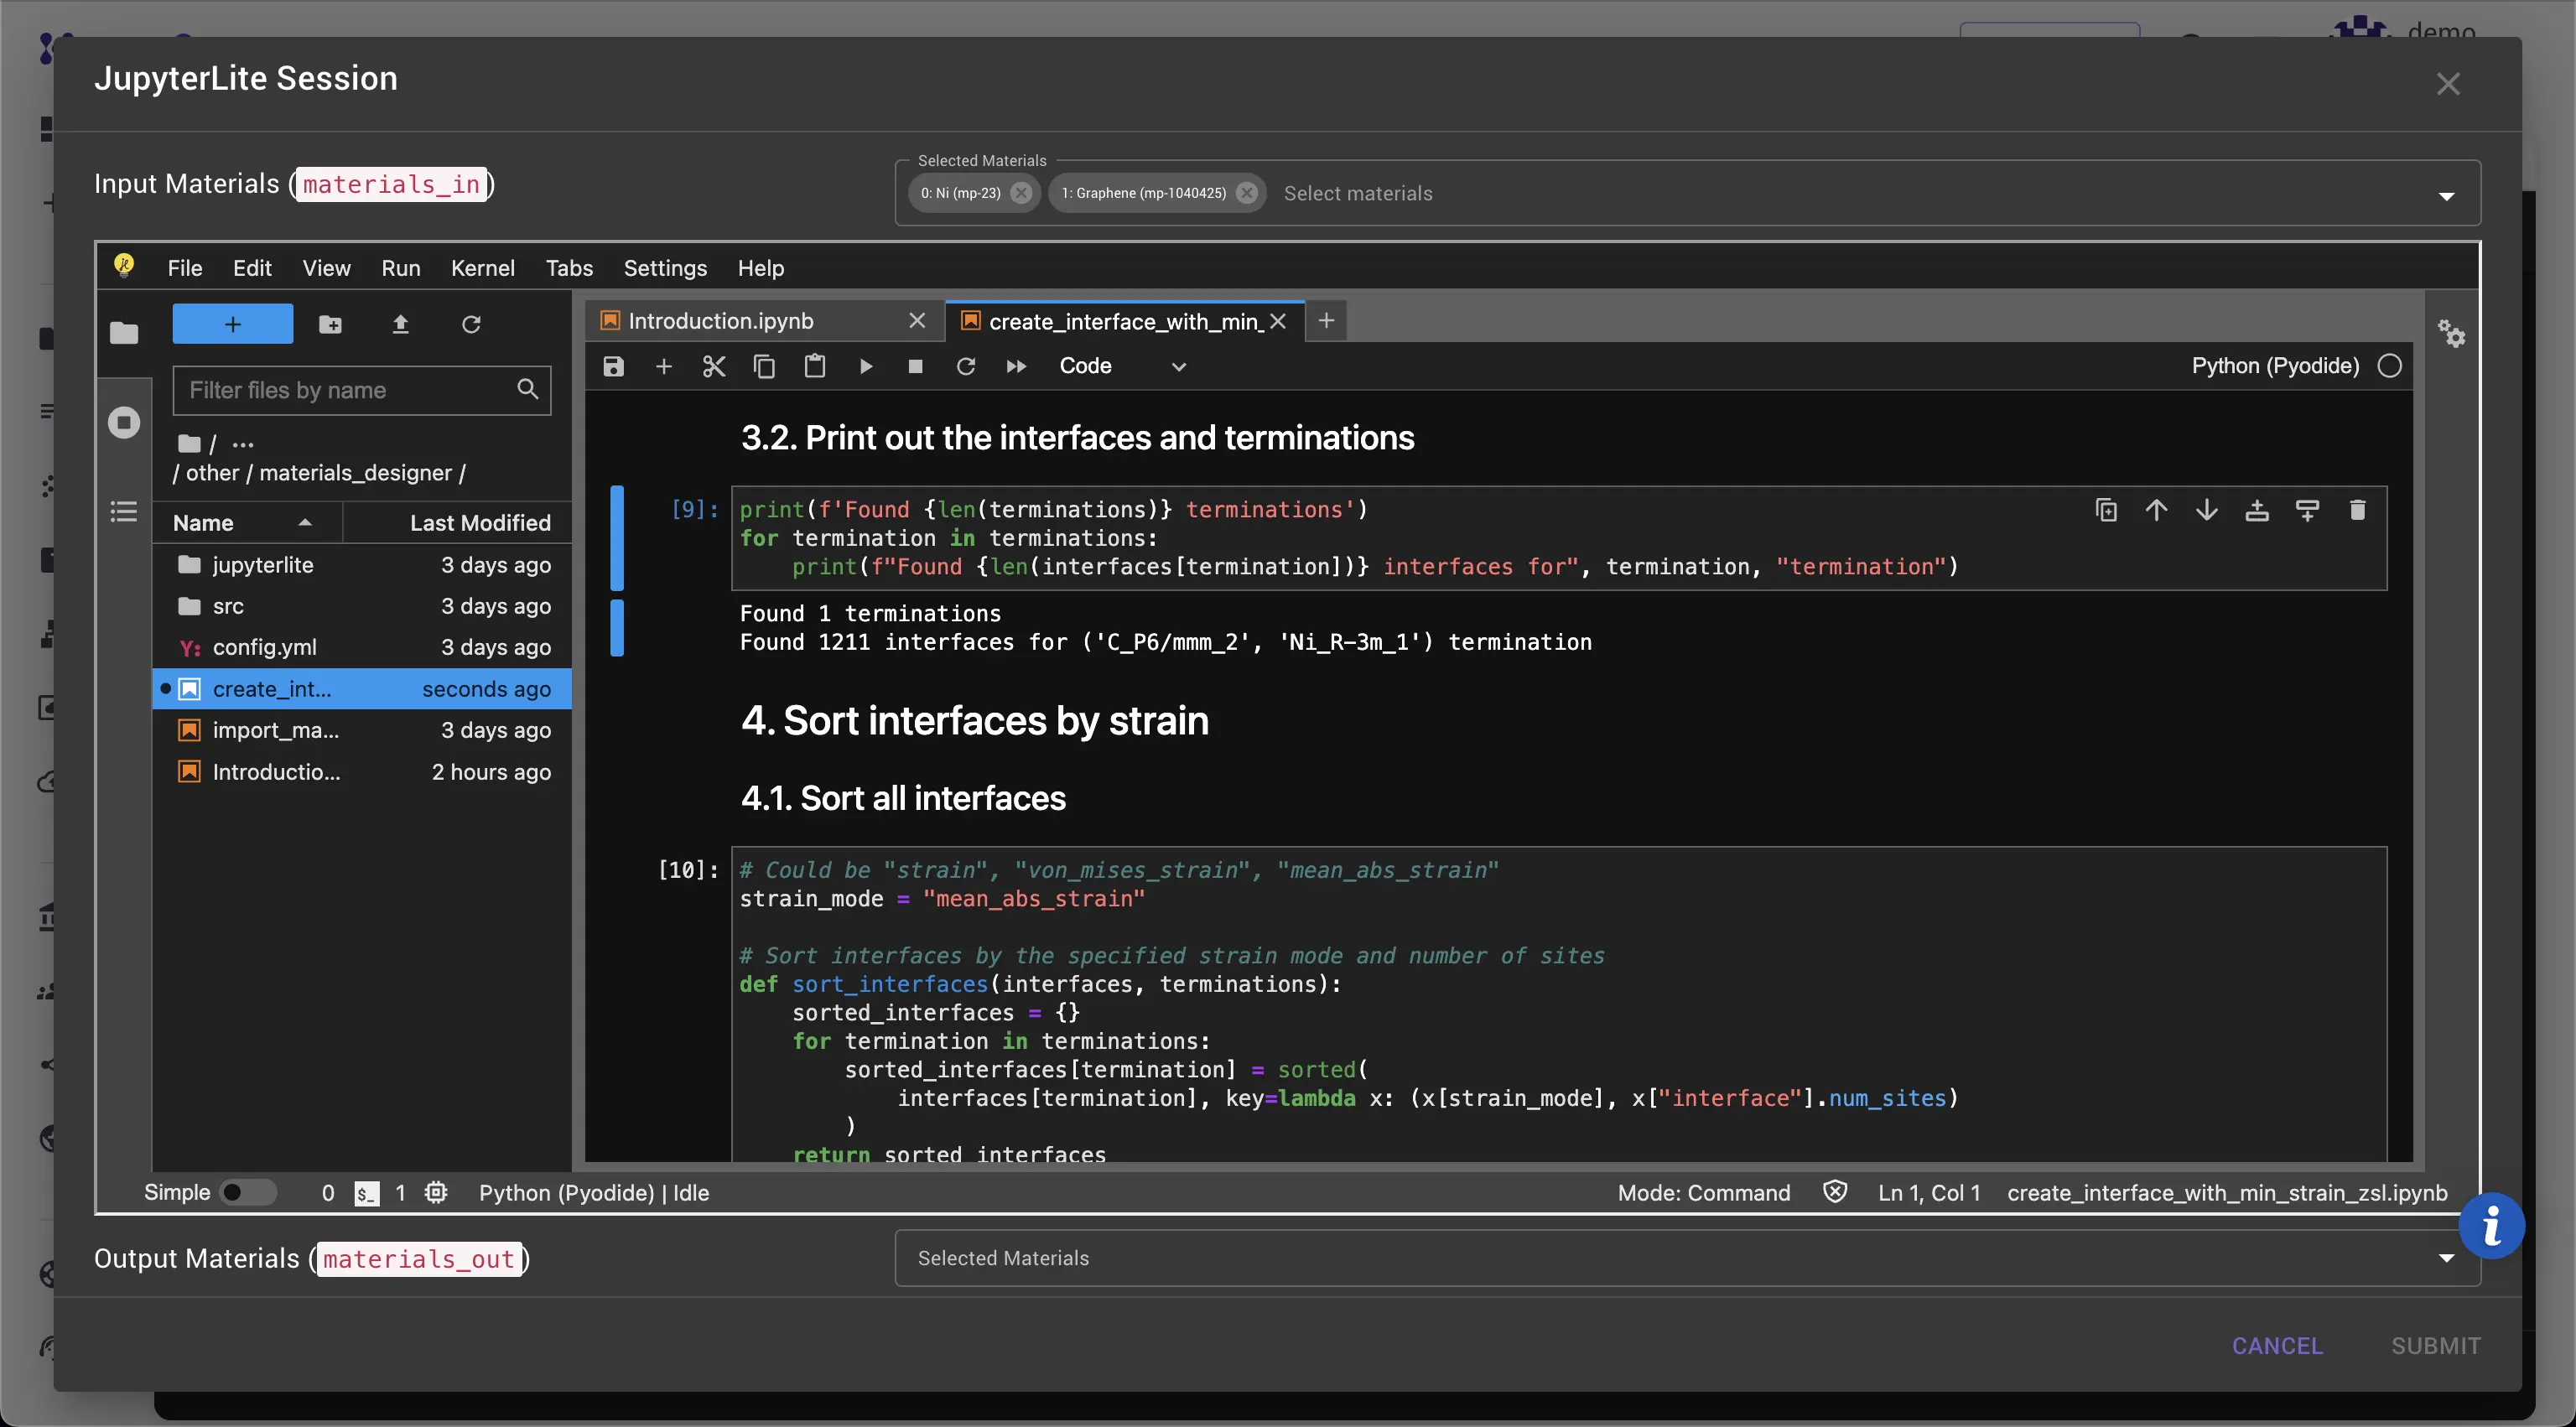
The output of the cell under "3.2. Print out the interfaces and terminations" displays the number of possible terminations (1 in this case) and the number of interfaces for each termination (1211 in this case).
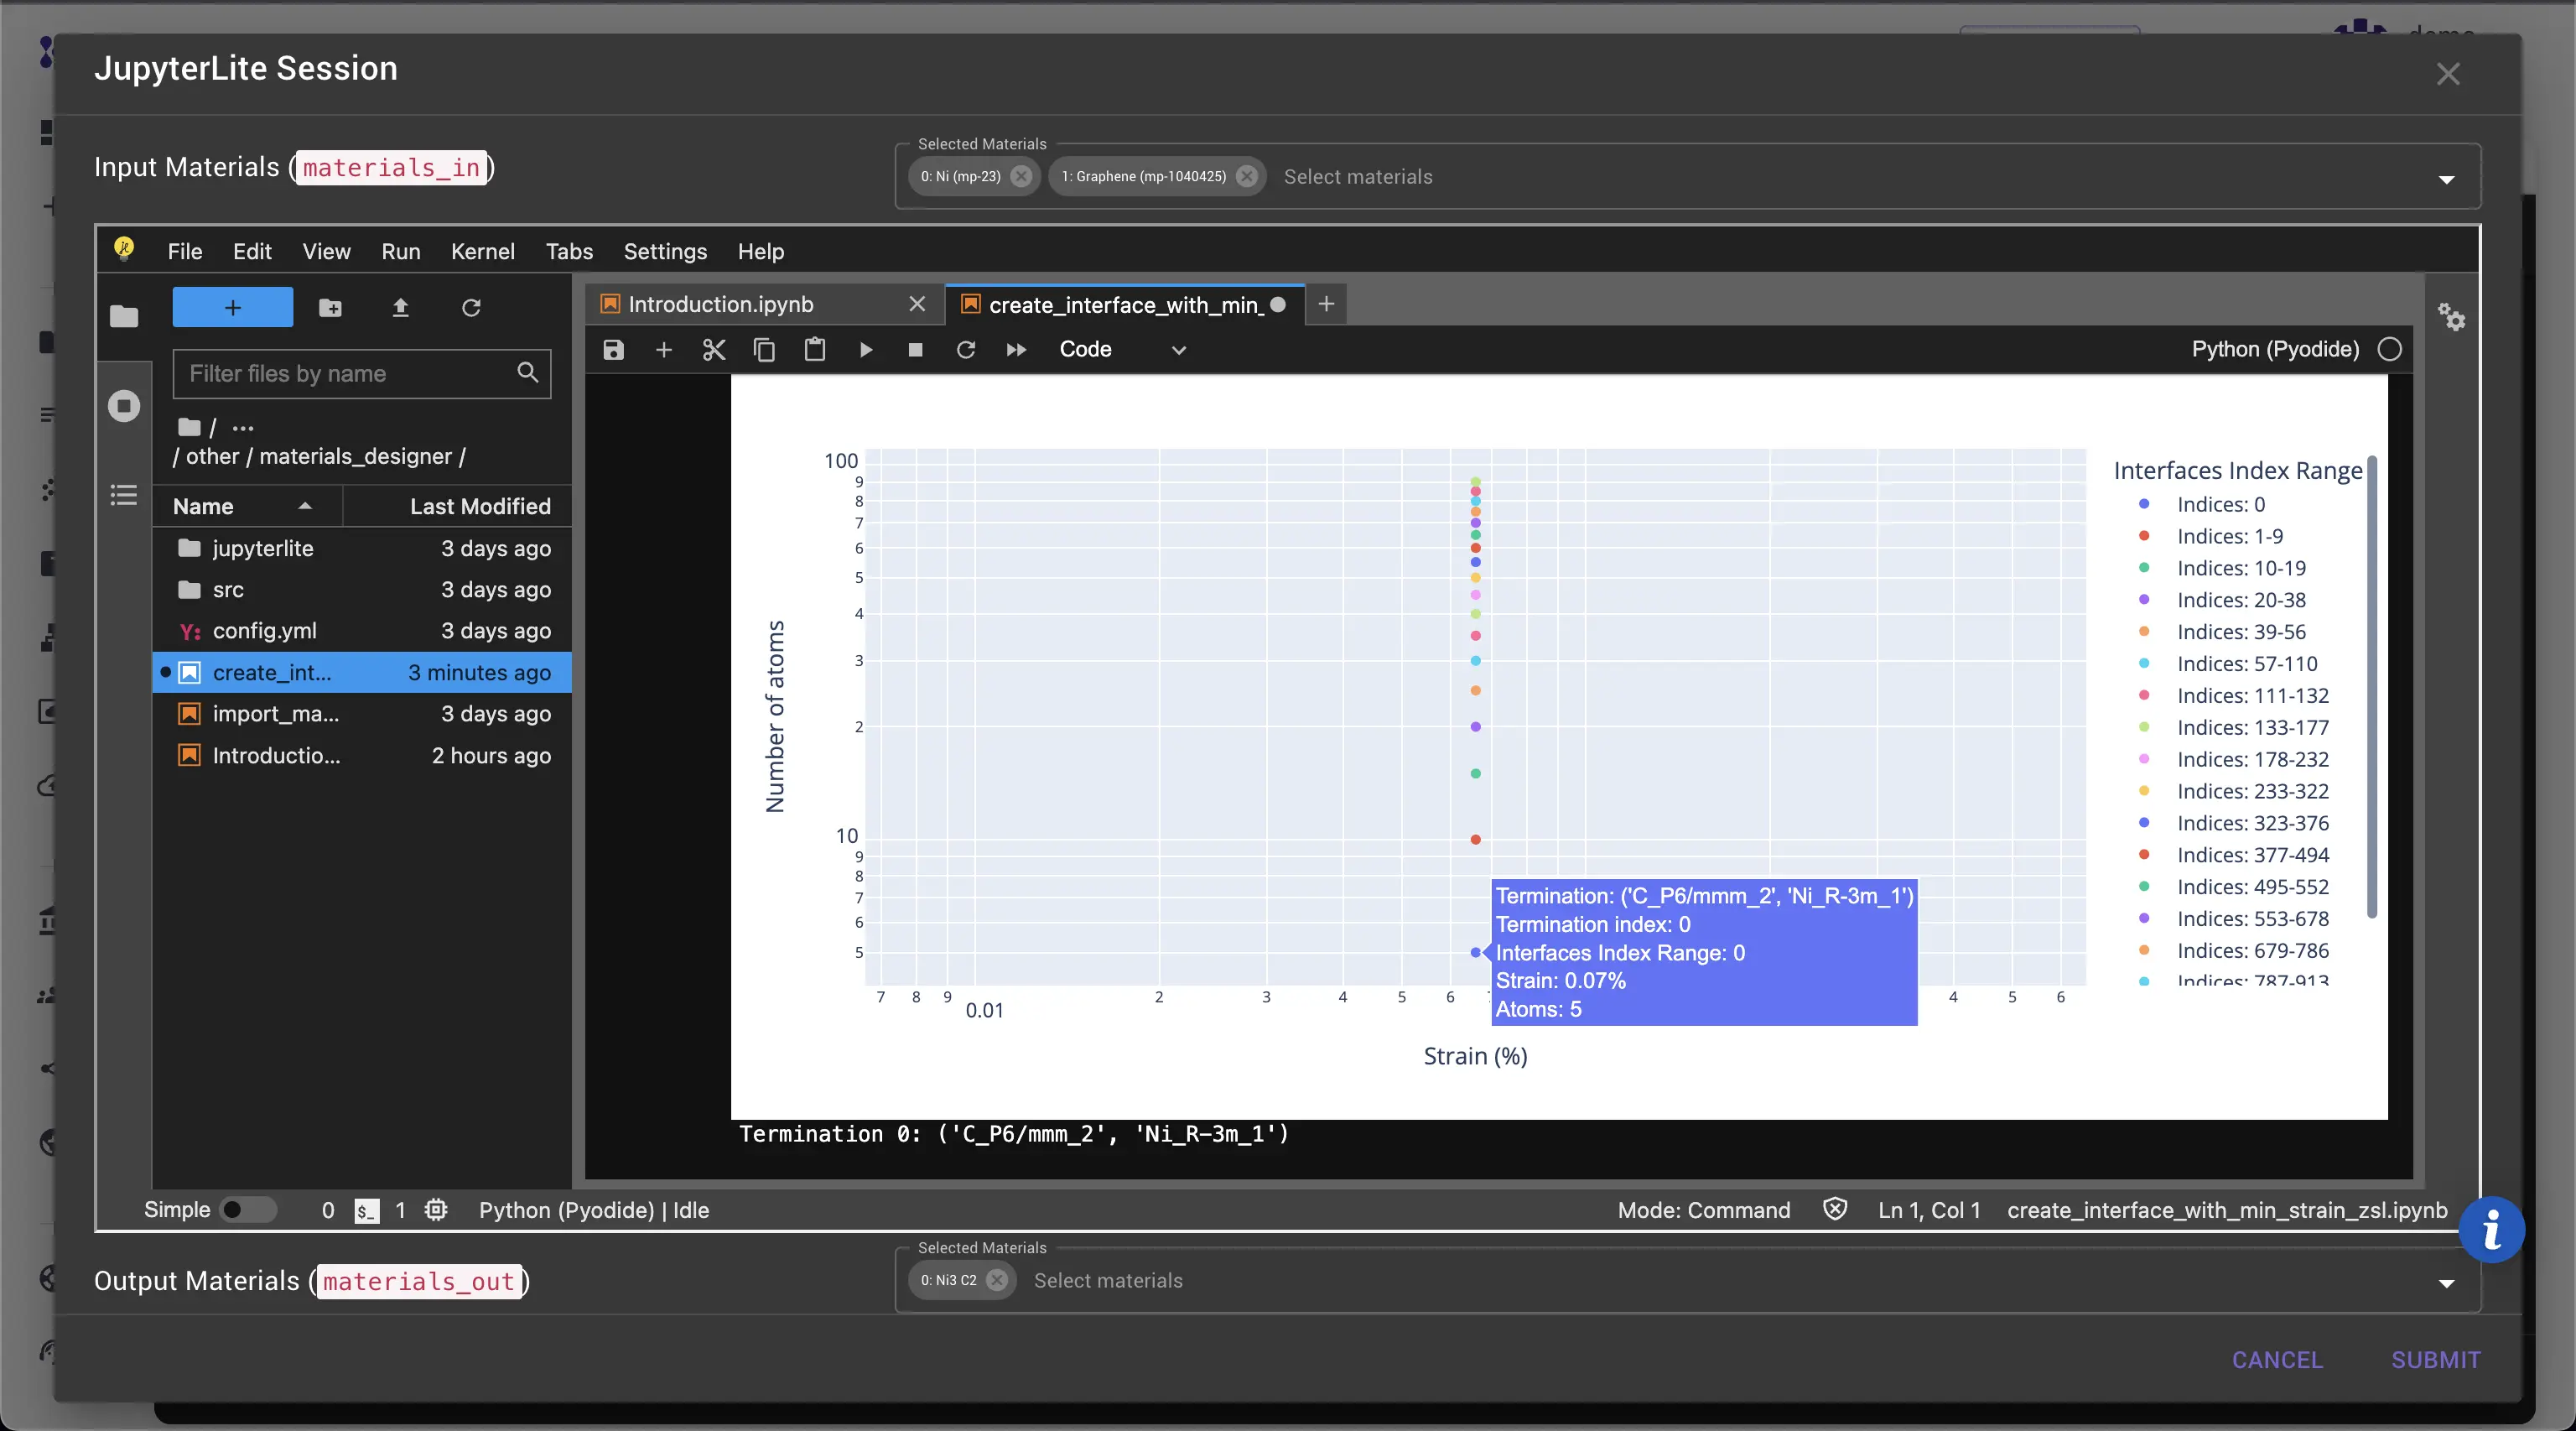
The output of cell "4.2. Print out interfaces with the lowest strain for each termination" displays the strain and number of atoms for the interface with the lowest strain per termination. The output of cell "5. Plot the results" displays a plot of strain vs. number of atoms for each interface. Each point on the plot represents an interface with data for termination, interface index, strain, and number of atoms.
6. Select the interfaces to return
Select the termination for the interface by setting the variable termination_index to the respective value (0 by default), then set the number of interfaces with the lowest strain to return (1 by default). Verify that the Output Materials dropdown contains the selected interfaces. Click Submit to pass materials to the Materials Designer session.
The Graphene-on-Ni(111) interface should now be available in the materials list and can be viewed in the 3D viewer.
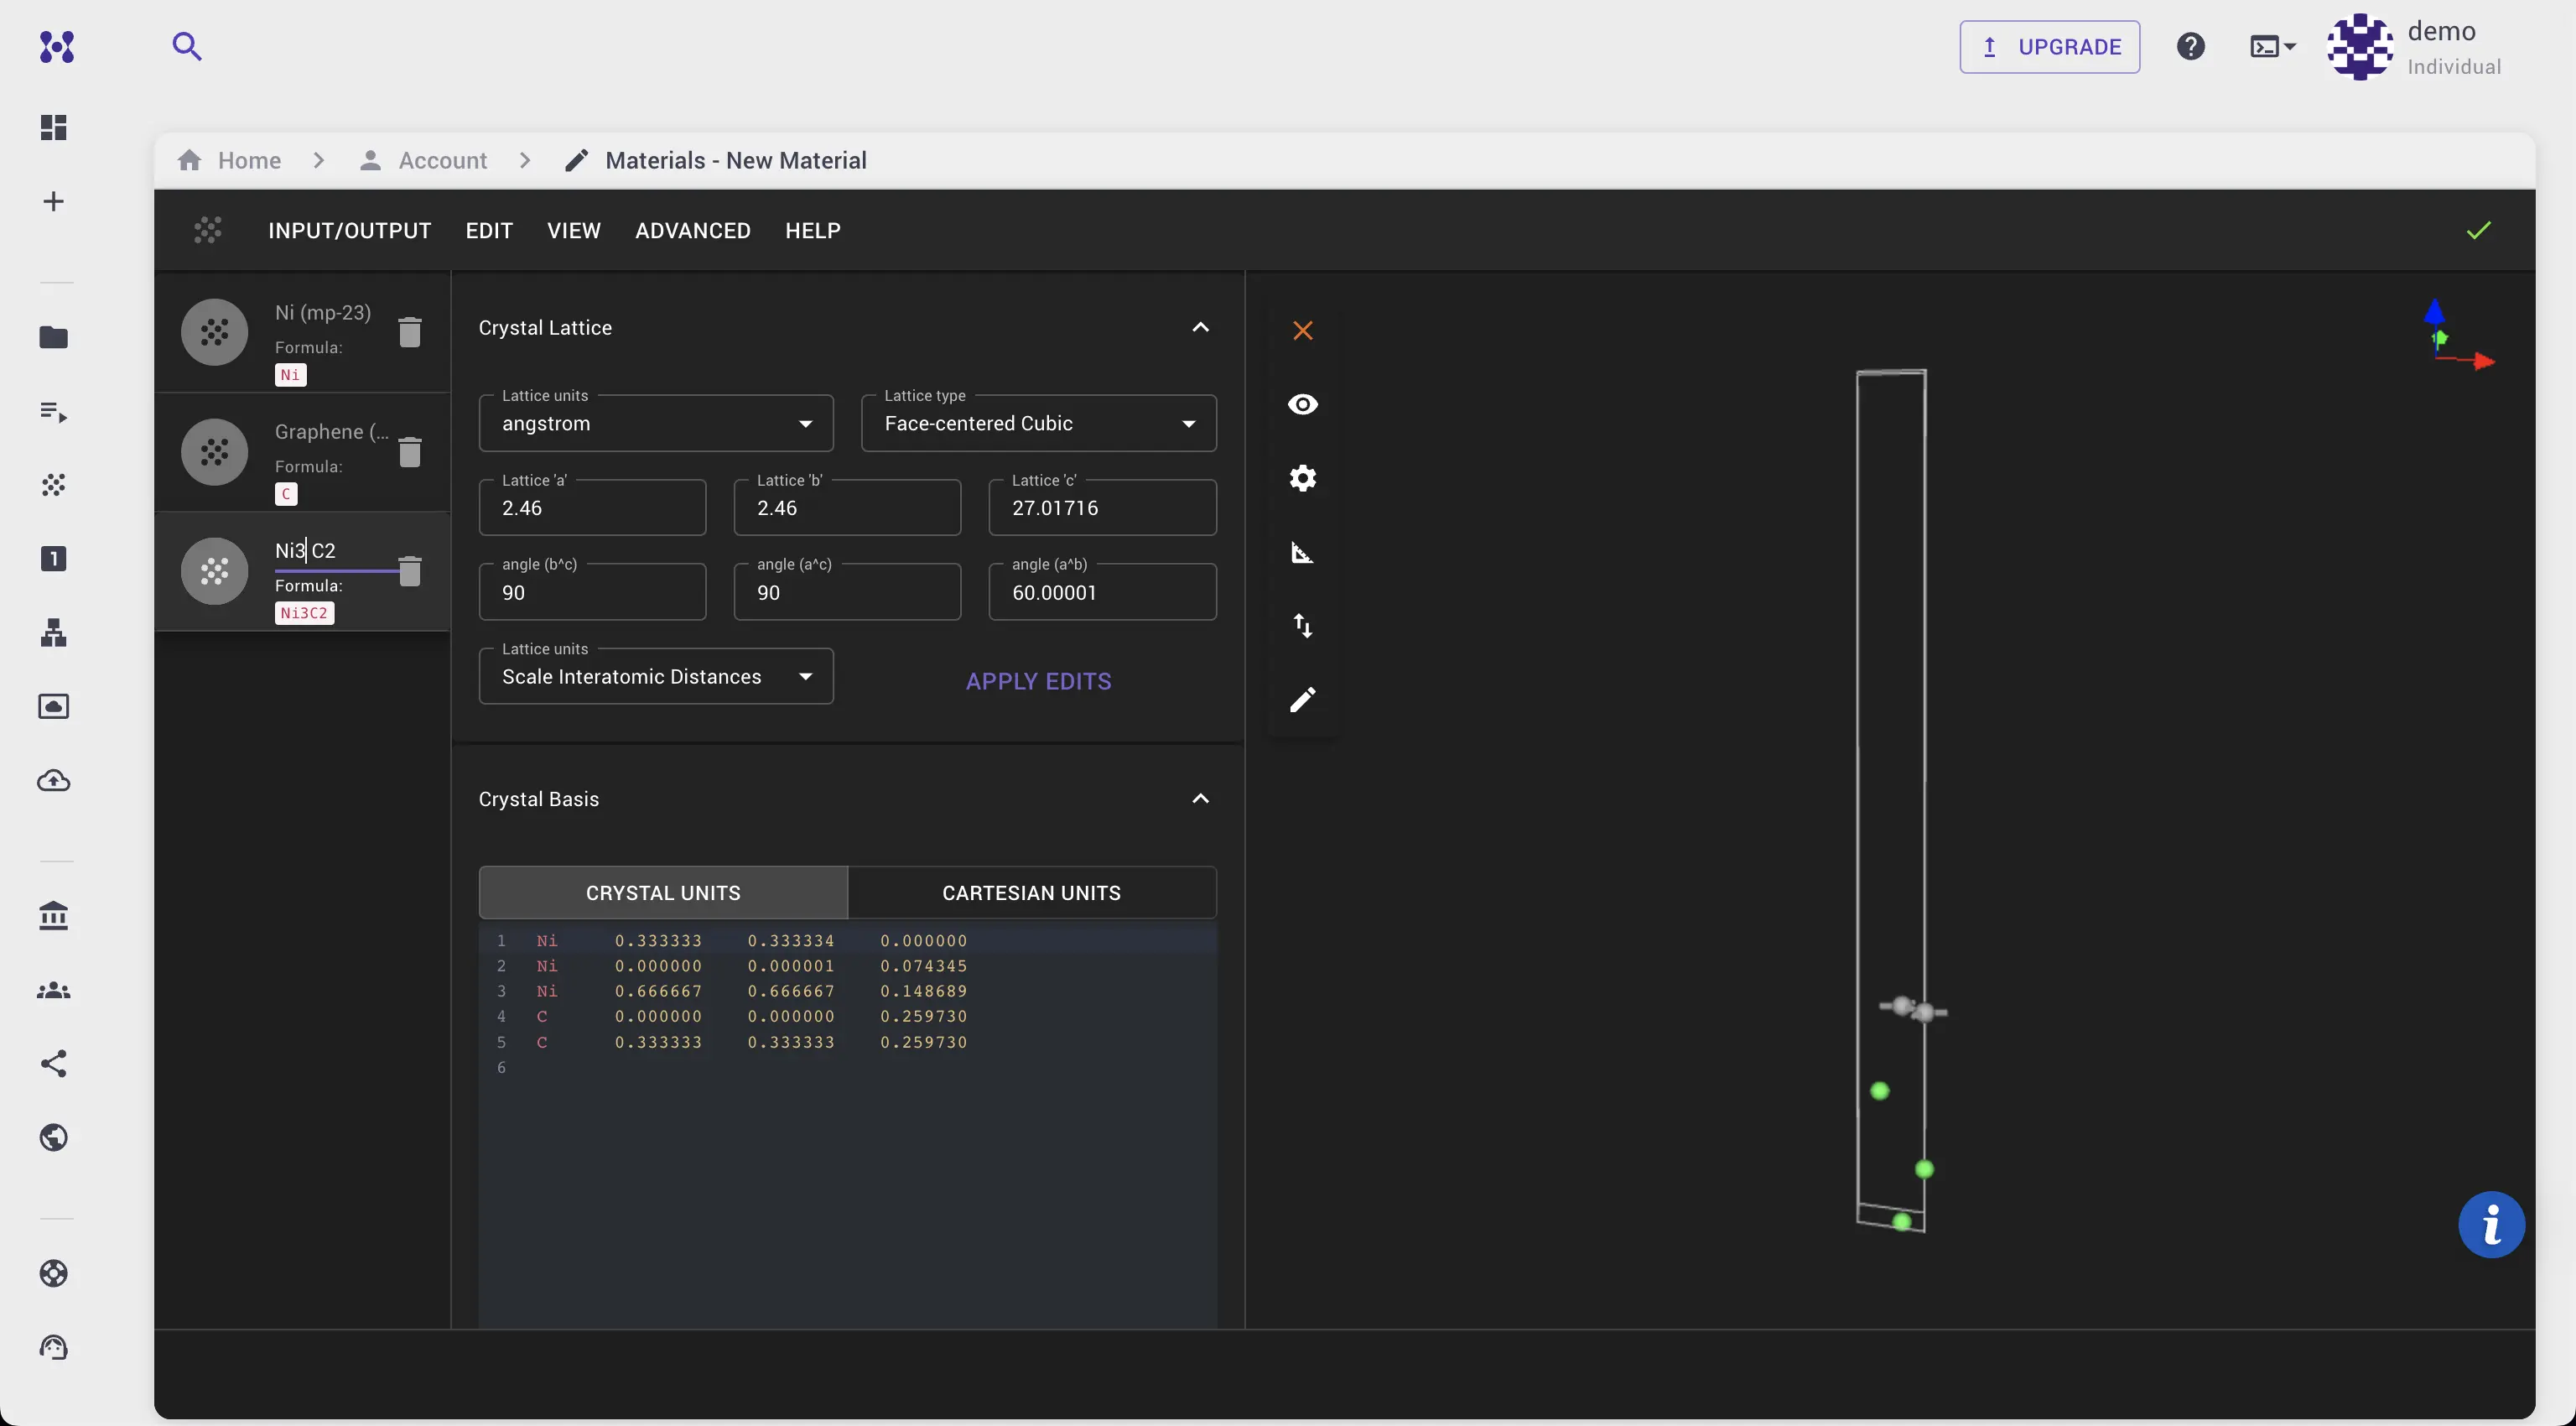
Repetitions along x and y directions and bonds can be added to visualize the result more clearly.